Figure 3. Hyperacetylation in retinal
ganglion cells after histone deacetylase inhibitor treatment.
Representative photographs of anti-acetylated histone proteins (AcH3;
green)- and anti-Thy-1.1 (red)- labeled retinal ganglion cells (RGCs)
of controls (A-C) and after sodium butyrate (SB)
treatment (D-F). Thy-1.1 immunolabeling was used to
specifically identify RGCs (white arrows) among other retinal cells
(black arrowheads). In comparison to the control, the AcH3
immunoreactivity seems upregulated in RGCs after SB treatment. The
scale bar in F is for all pictures and represents 100 µm. The
insets show a single RGC at a higher magnification.
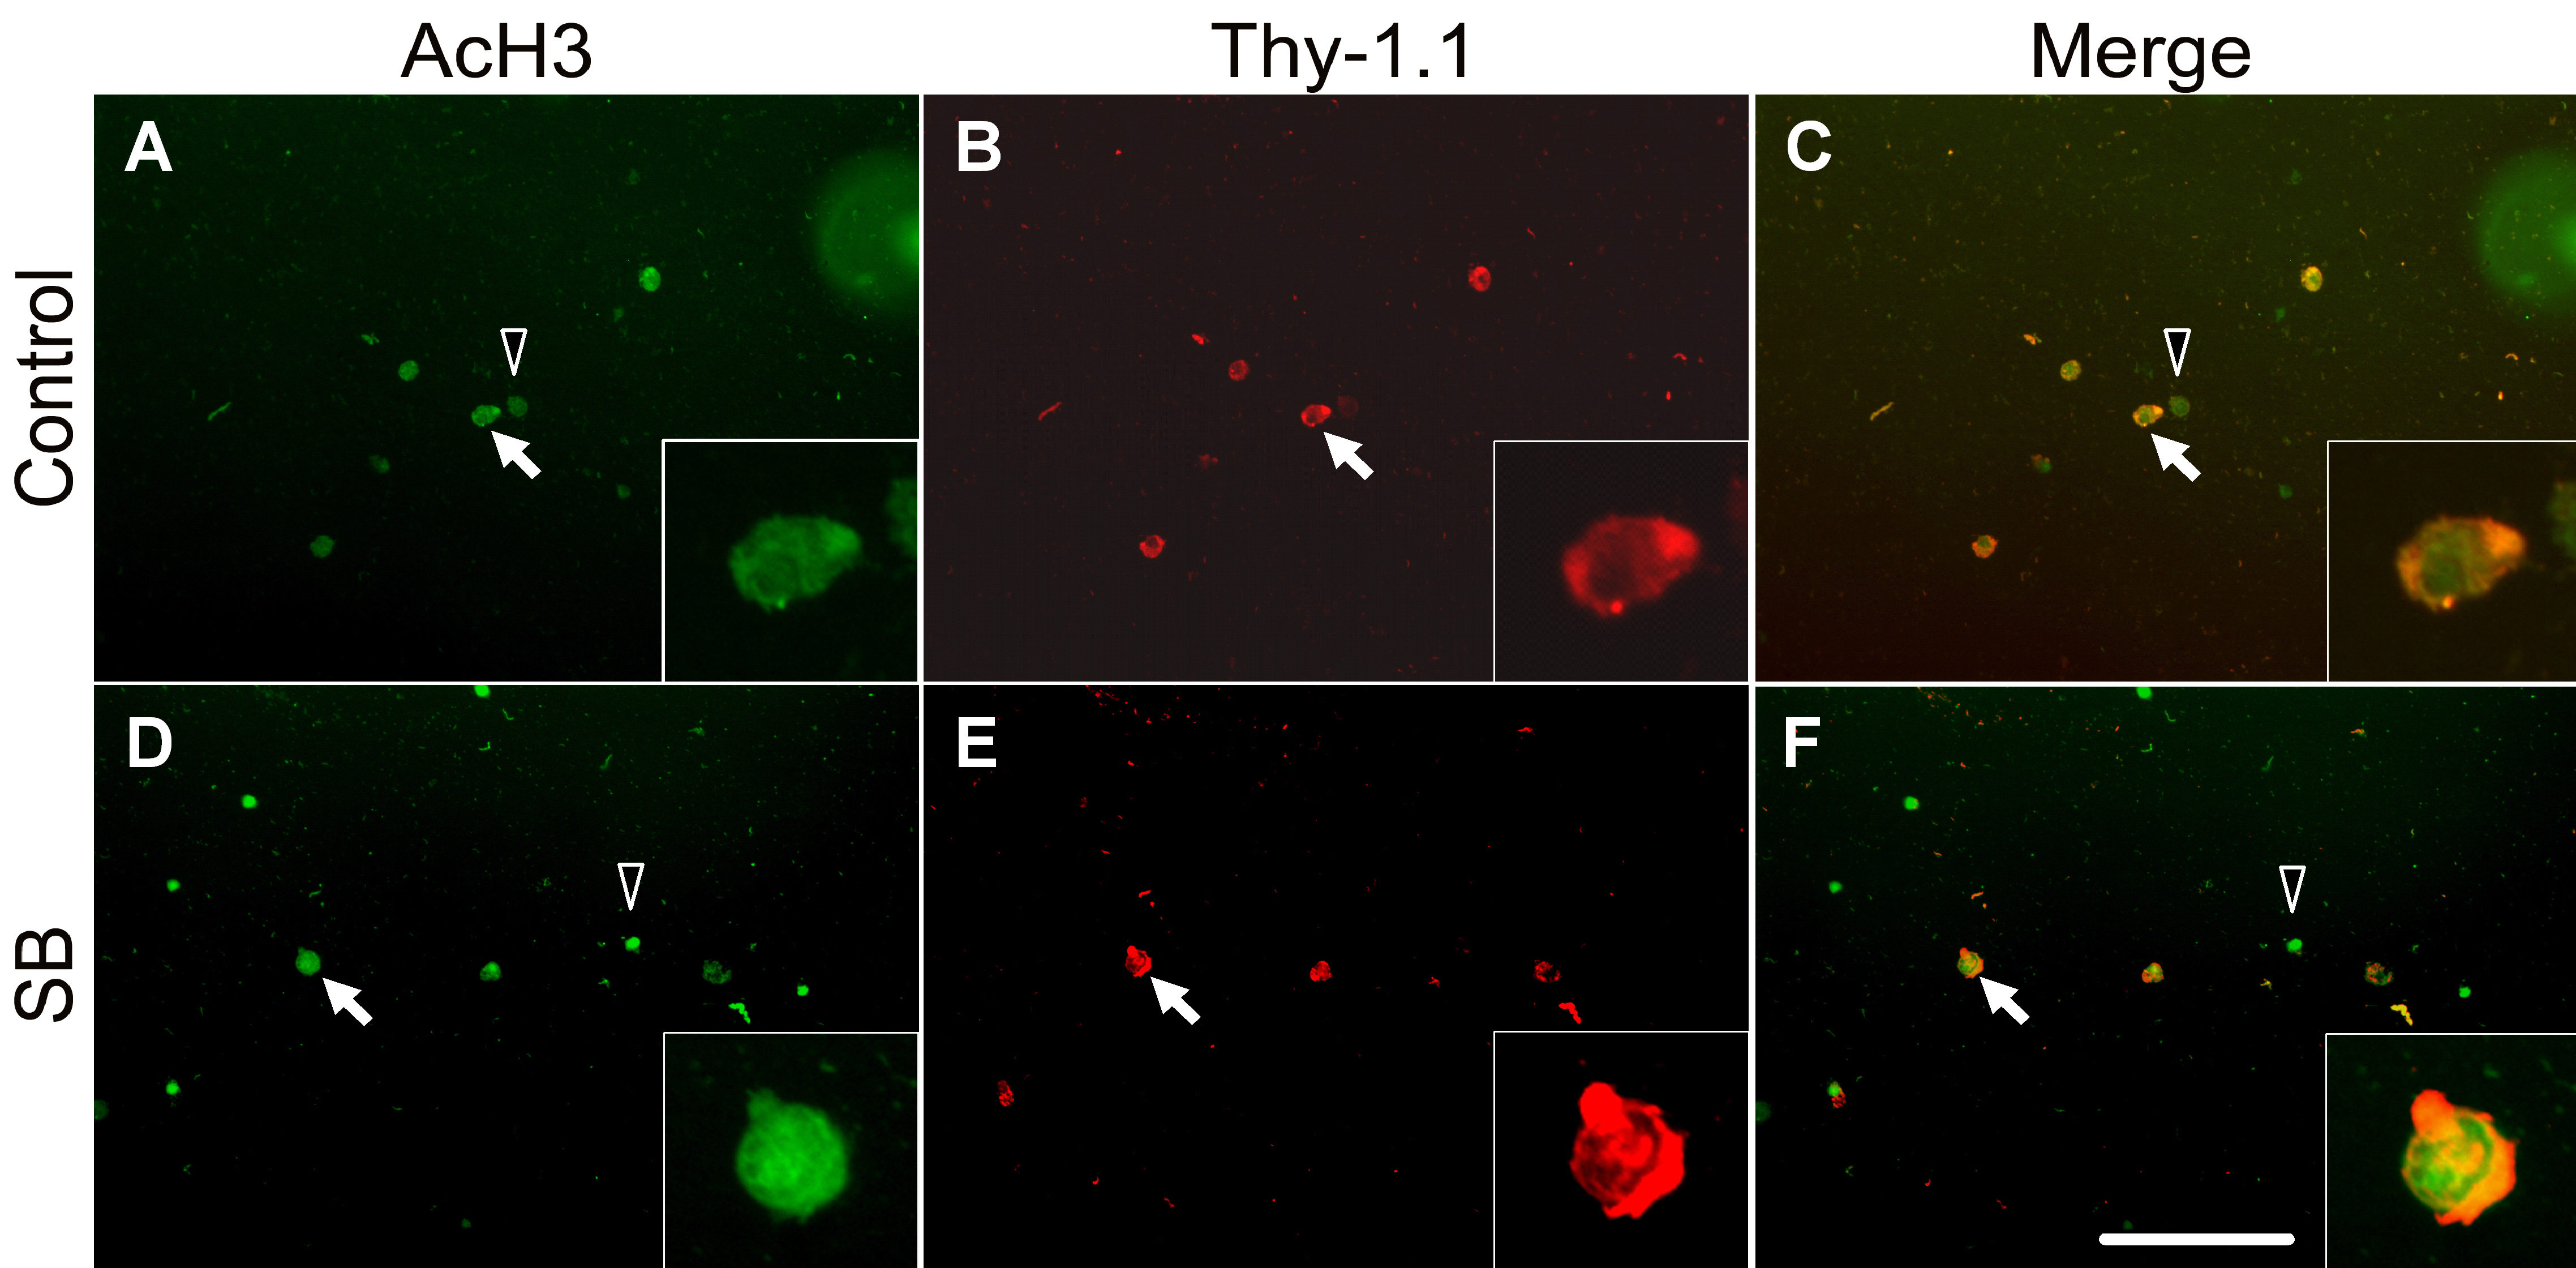
 Figure 3 of Biermann, Mol Vis 2011; 17:395-403.