Figure 8. AII amacrine cell 514 in RC1 displays axosomatic synaptic input. A: Section 58 (z 58) shows two axosomatic synapses (circled, Scales, 10 and 1 μm). B: Section 61 (z 61), with GABA overlay in orange, shows that the axosomatic synaptic terminal has the same GABA negative signal
as the AII amacrine cell but is flanked by orange GABA+ processes (Scale, 1 μm). C: A serial section series from section 57 (z 57) through 67 (z 67), omitting section 61 shown in panel B, shows that axosomatic synapses are formed at z 57 & z 58. Several sections show large dense-core vesicles (circle in z 67)
characteristic of TH cells (Scale, 1 μm). D: Goniometric tilt re-imaging of the oblique synaptic contact in panel C z 58. A 55° tilt aligns the axosomatic contact membrane,
and clearly shows a characteristic 10 nm synaptic gap and polarity (arrow) targeting AII amacrine cell 514.
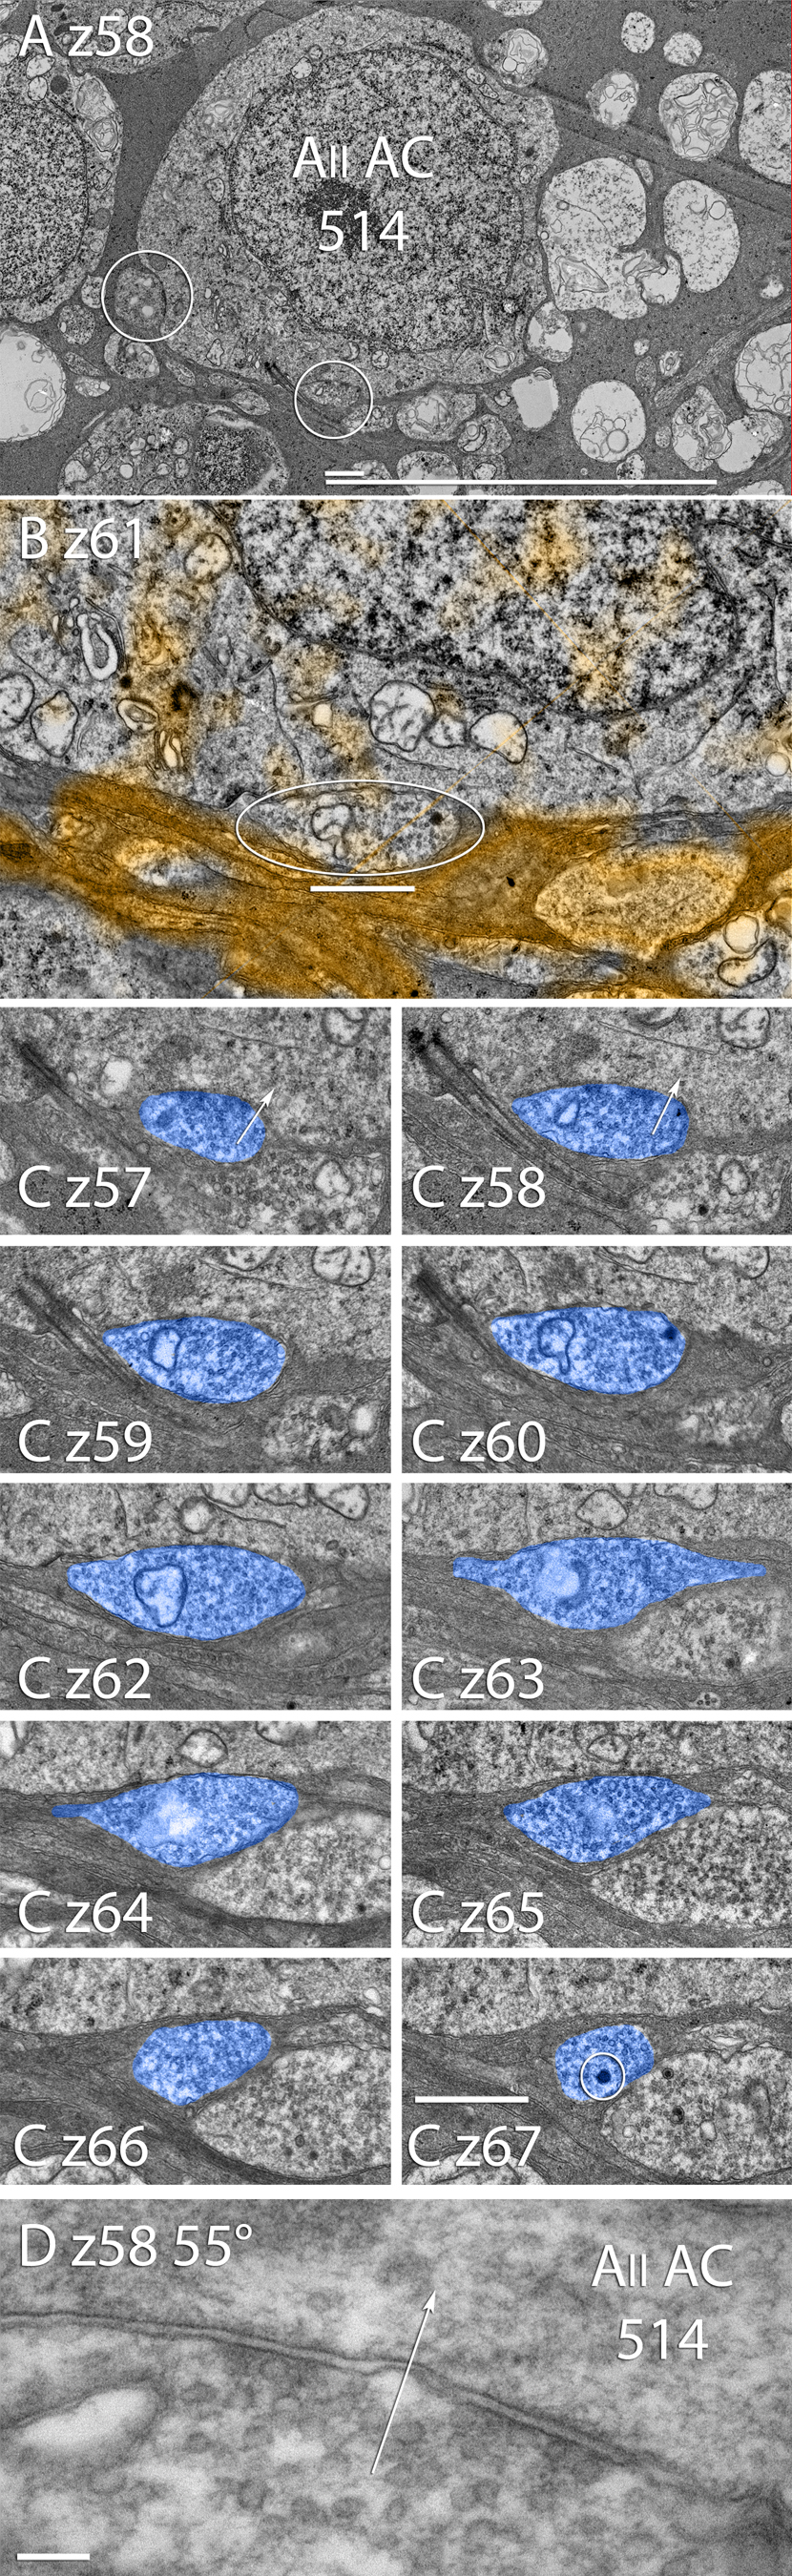
 Figure 8 of
Anderson, Mol Vis 2011; 17:355-379.
Figure 8 of
Anderson, Mol Vis 2011; 17:355-379.