Figure 4. A fragment of the mammalian AII
amacrine cell network is visualized by rendering and transmission
electron microscope (TEM). A: Viking-rendered AII amacrine
cells (C476, C514, C2610) and rod (B518), OFF (C478) and ON (C1724)
bipolar cells form a local network. Each bipolar cell was chosen to
mark the center of the cone OFF, cone ON and rod driven zones of the
inner plexiform layer. The small red, blue and yellow details represent
postsynaptic, presynaptic and gap junction contact sites. They are
scaled to true size, so most of them are below the figure’s resolution.
Only the largest are visible (scale, 20 μm). B: Rod BC B518
(blue) presynaptic (r) to AII amacrine cell C476 (green) and γ+ AC
C4942 (orange); γ+ ACs C4941 and C4942 are presynaptic (arrows) to
B518. C: AII amacrine cell C514 (green) to OFF cone BC C478
(blue) synapses (arrows). C514 makes conventional synapses onto C478 at
its terminal swelling and fine inter-varicosity processes (box, 6
sections away). D: AII amacrine cell C514 (green) and γ+ AC
C5285 (orange) are both presynaptic (arrows) to OFF GC C5150 (magenta).
E: Heterocellular coupling (between black arrows) between ON
cone BC C1724 (blue) and AII amacrine cell C514 (green). The inset
(width 169 nm) is a high resolution tilt TEM image of the gap junction.
F: Homocellular coupling (arrows) occurs among AII amacrine
cells C514, C476, and C3679. The scales for panels B-F
are 500 nm.
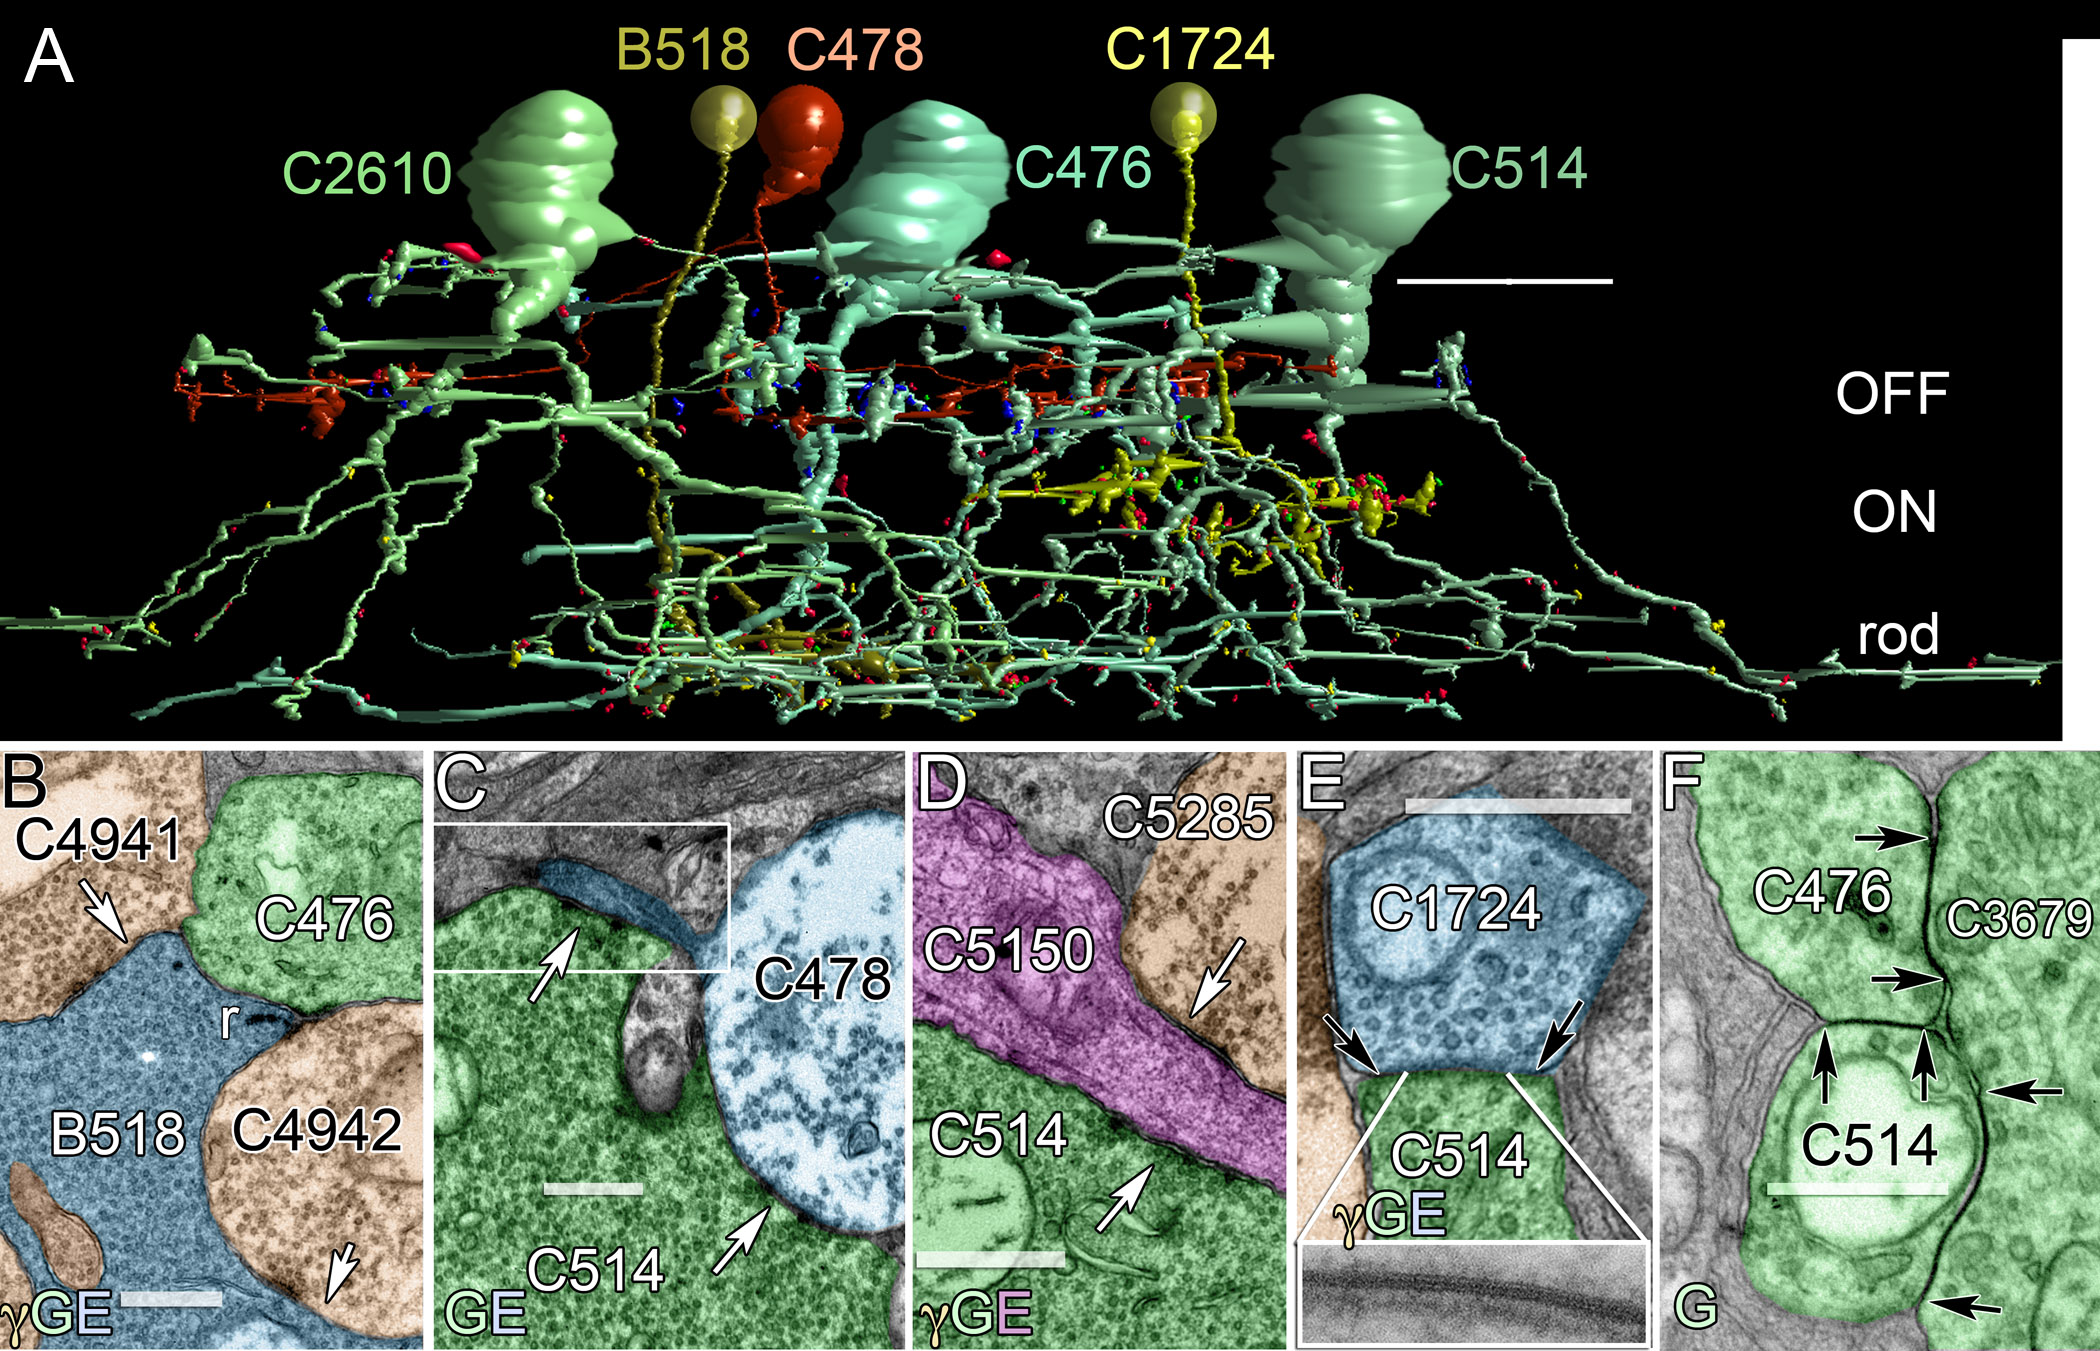
 Figure 4 of Anderson, Mol Vis 2011; 17:355-379.