Figure 3. The computational molecular
phenotyping (CMP) matrix for volume RC1 is bounded by CMP data sets and
intercalated every thirty sections with ultrathin CMP sections that map
molecular tags onto transmission electron microscope (TEM) data. Each
row of 2 or 3 fields contains a TEM slice with its associated index
number, one or more optical CMP channels composed of one to four
molecular tags, and for fields in the inner nuclear and ganglion cell
layer, overlay images of the CMP data registered onto the TEM channel.
Each disc is 243 μm in diameter. The matrix was assembled from 32x
down-scaled TEM data sets (70 nm/pixel). This represents a threefold
oversampling of the optical data. The abbreviations and color key for
the figure are: B, 1-amino-4-guanidobutane, color=cyan; E, glutamate,
color=blue; G glycine, color=green; γ, GABA, color=red (slices 001,
371) or magenta (slices 62, 184, 312); τ taurine, color=gold (slice
001), red (slice 371), or orange (slices 122, 244); γG → γ magenta: G
green; γGE → γ red, G green, E blue; γGEτ → γ red, G green, E blue +
gold τ alpha channel overlay mask; γBE → γ red, B green, E blue; τQE →
τ red, Q green, E blue.
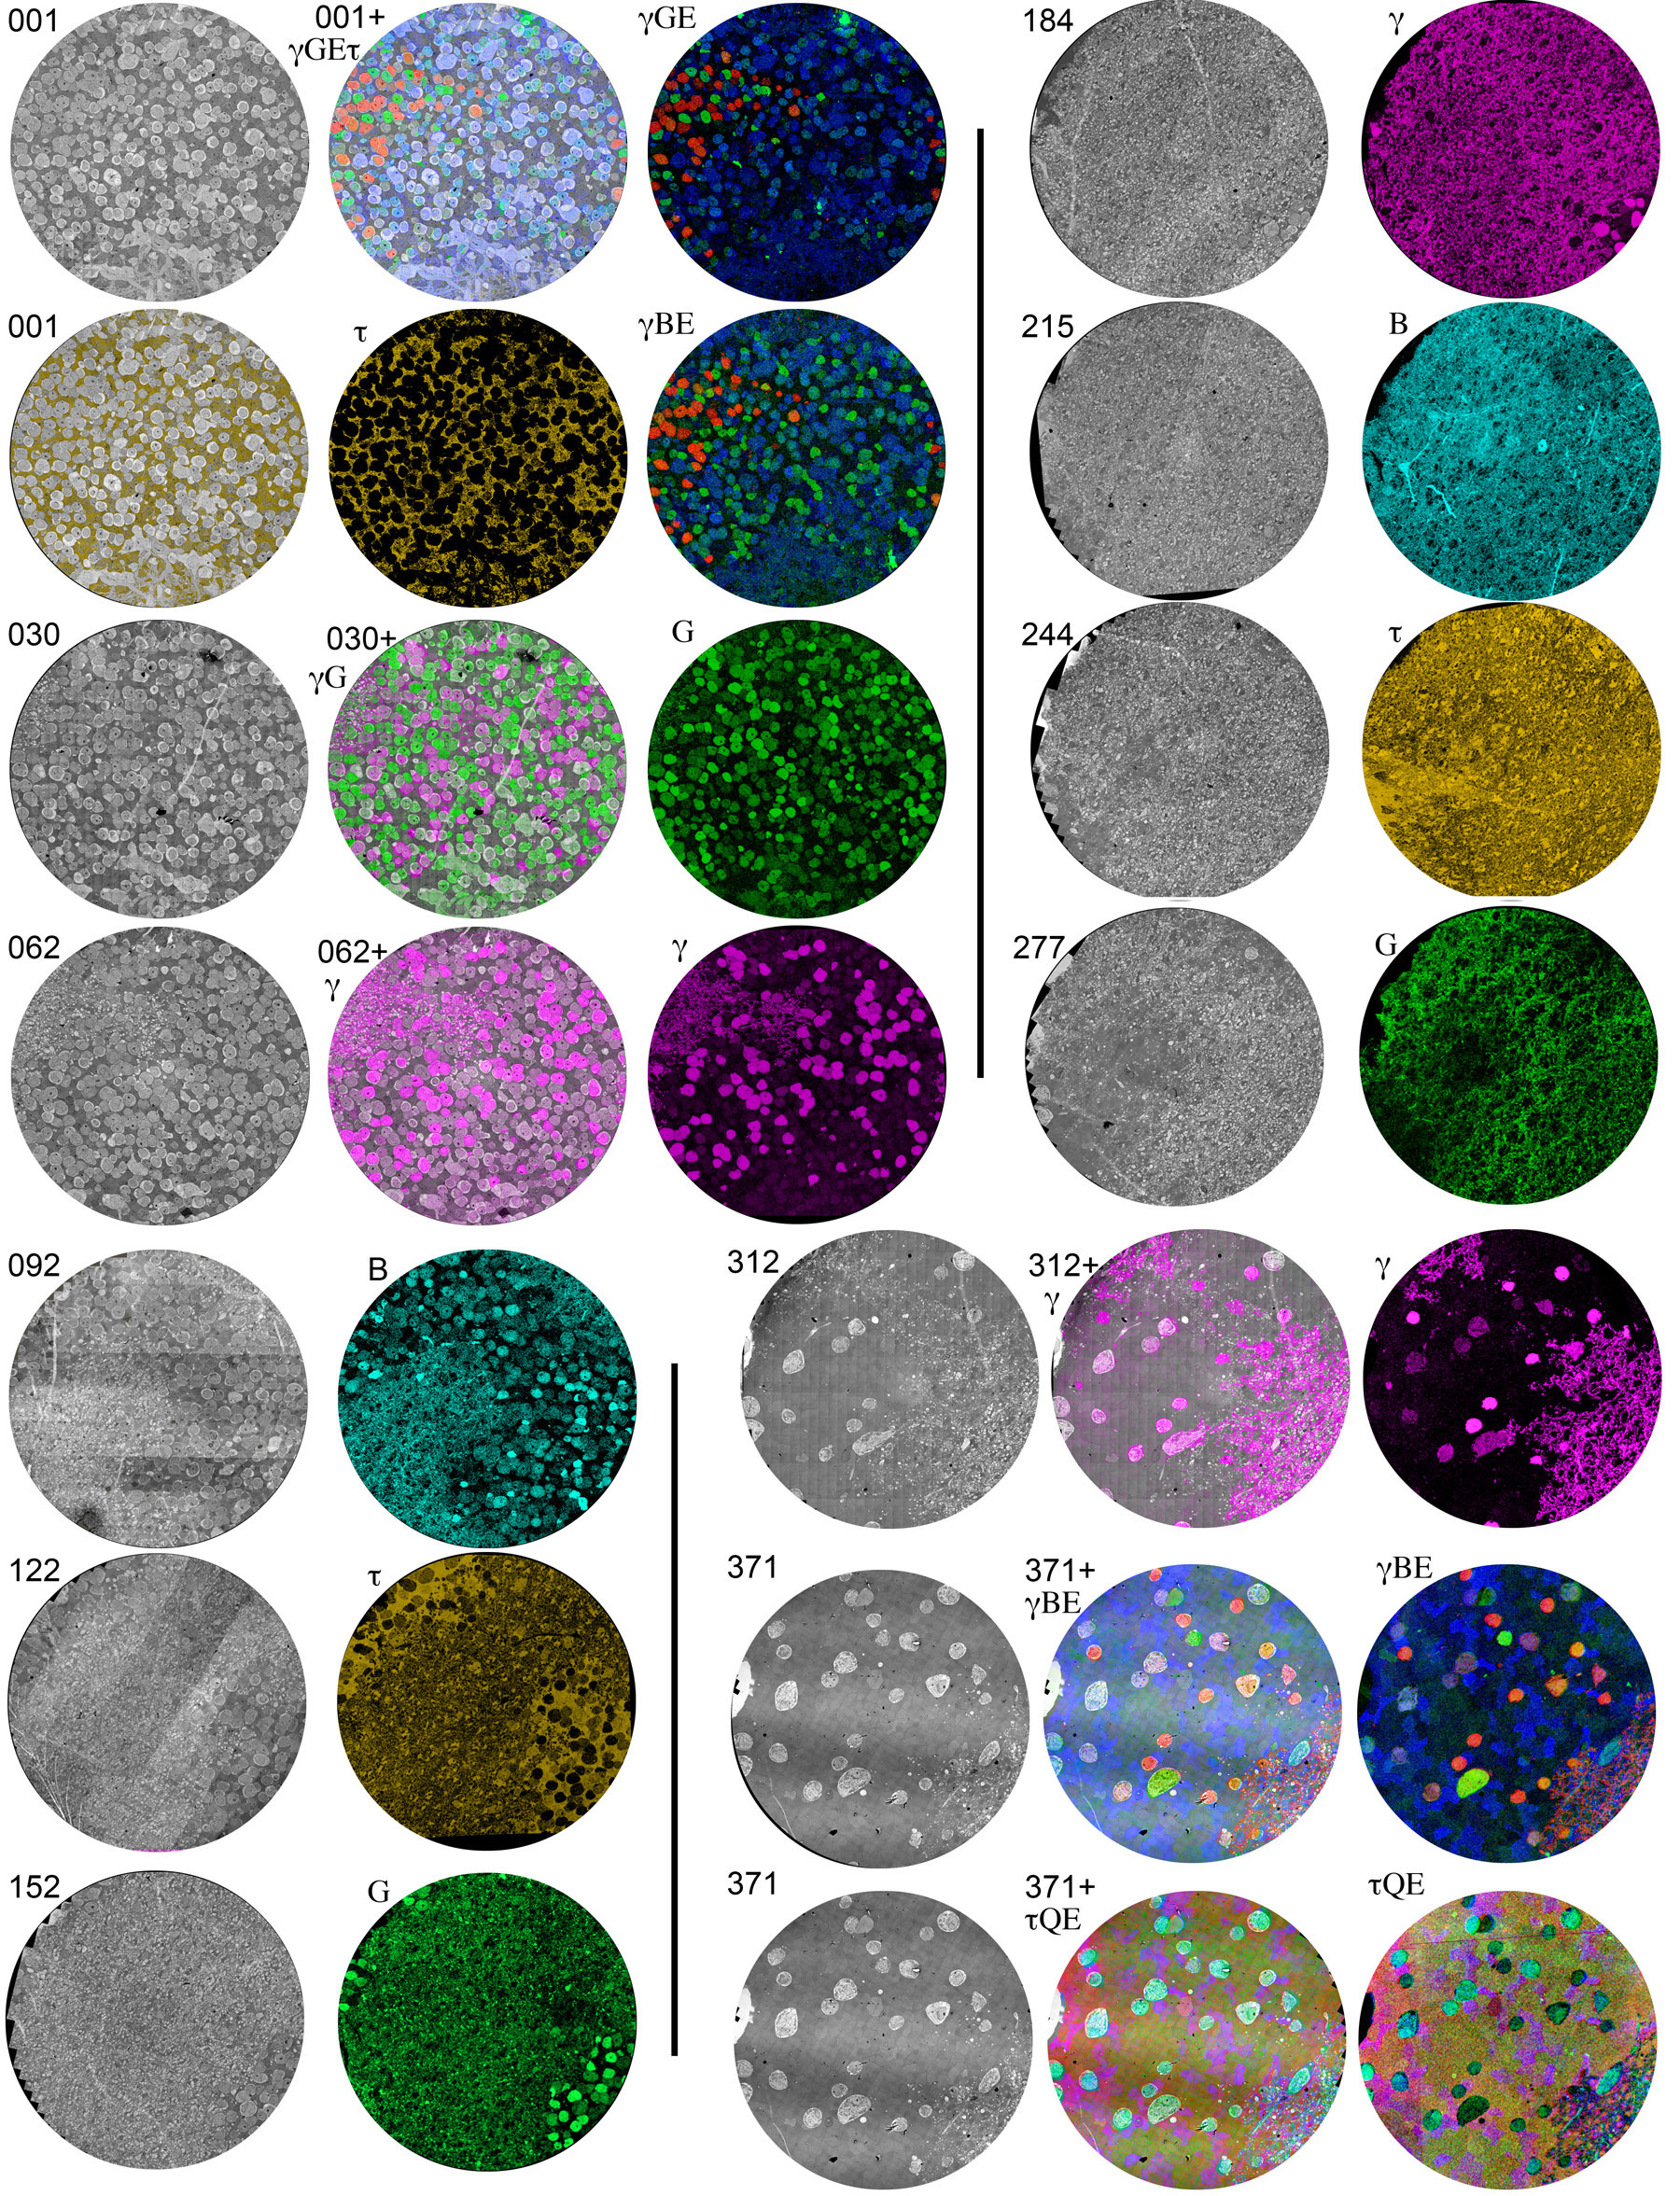
 Figure 3 of Anderson, Mol Vis 2011; 17:355-379.