Figure 2. Connectome RC1 data sets were
visualized by fusing transmission electron microscope (TEM) images and
computational molecular phenotyping (CMP) signals. A: TEM
section 001 is a near-horizontal plane section through the inner
nuclear layer (INL) of the retina, visualized with
4-aminobutyrate(GABA).glycine.glutamate (γGE) → red.green.blue (RGB)
transparency mapping, displaying retinal neurons, and a dark gold alpha
(α) channel derived from taurine and glutamine (τQ) channels marking
retinal glia (γGE.τQ) → RGB.α (see Methods). GABA+ (red) neurons are
amacrine cells, while glycine+ (green) neurons are either amacrine or
an ON cone bipolar cell subset. Glutamate+ (blue) neurons are largely
bipolar cells. The image width is 243 μm. B: TEM section 030 is
a connectome slice roughly 2.5 μm deeper in the INL, visualized with a
GABA.glycine → magenta.green transparency (γG=MG; see Methods). The
circled cells represent 12 validated AII amacrine cells, 8 visible in
section 030 (solid circles) and 4 originating in a plane beneath
section 030 (dashed circles). The image width is 243 μm. C: TEM
section 184 with orange GABA (γ) overlay (see Methods) shows that all
bipolar cell terminals are GABA- (boxes), as are lobular appendages of
AII amacrine cells (circle), a descending portion of AII amacrine cell
C4835, and the radial fibers of Müller cells (asterisks). Numerous
GABA+ processes and a weakly labeled ganglion cell dendrite (arrow) are
present. The image scale is 5 μm.
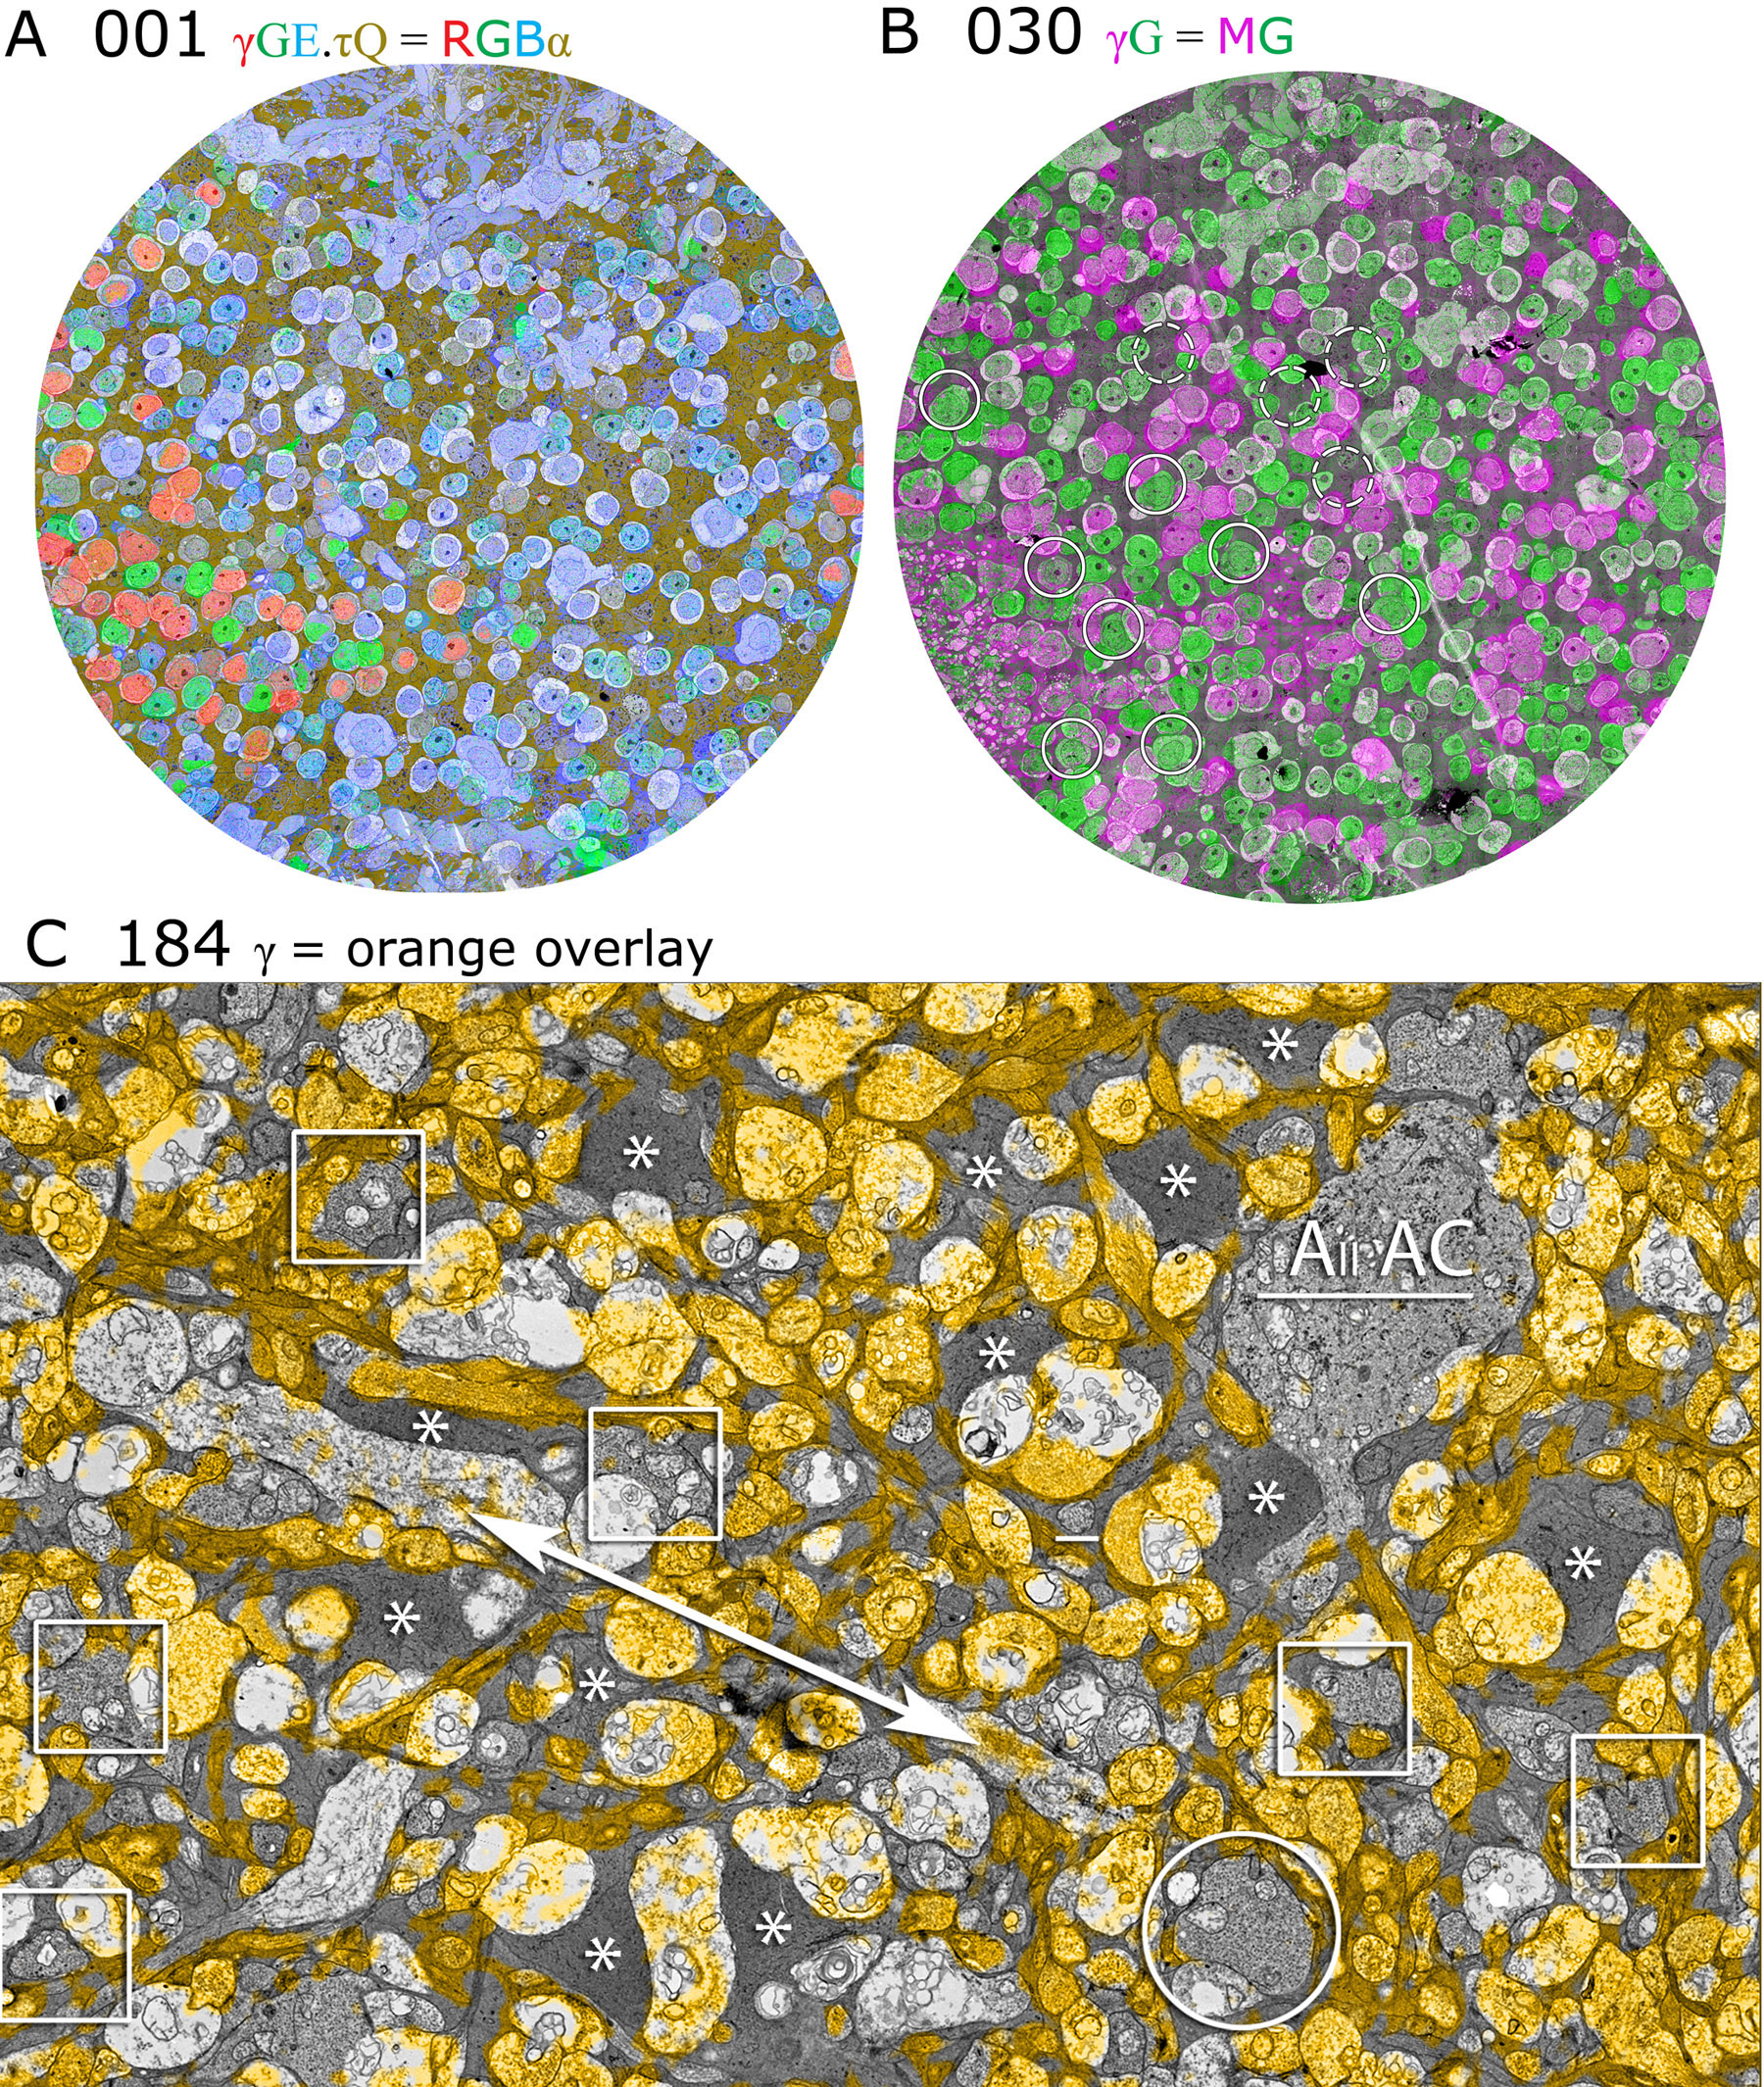
 Figure 2 of Anderson, Mol Vis 2011; 17:355-379.