Figure 16. AGB mapping allows
visualization of bipolar cell light responses. A: Slice 001
transmission electron microscope (TEM) with an overlay of glycine:AGB →
magenta.green mapping shows a collection of mapped bipolar cells. B:
Slice
001 with glycine:AGB → magenta.green mapping alone shows only the
molecular signatures of the cells. C: Slice 001 with greyscale
glycine intensity mapping reveals both glycinergic amacrine cells and
bipolar cells coupled to AII amacrine cells. D: Slice 001 with
greyscale AGB intensity mapping displays the light responses of all
bipolar cells. Six identified bipolar cells are circled: one G+ WF
(wide-field) bipolar cell (170), two OFF bipolar cells (173, 175), two
rod bipolar cells (5595, 5614) and one non-coupled ON layer bipolar
cell (5292).
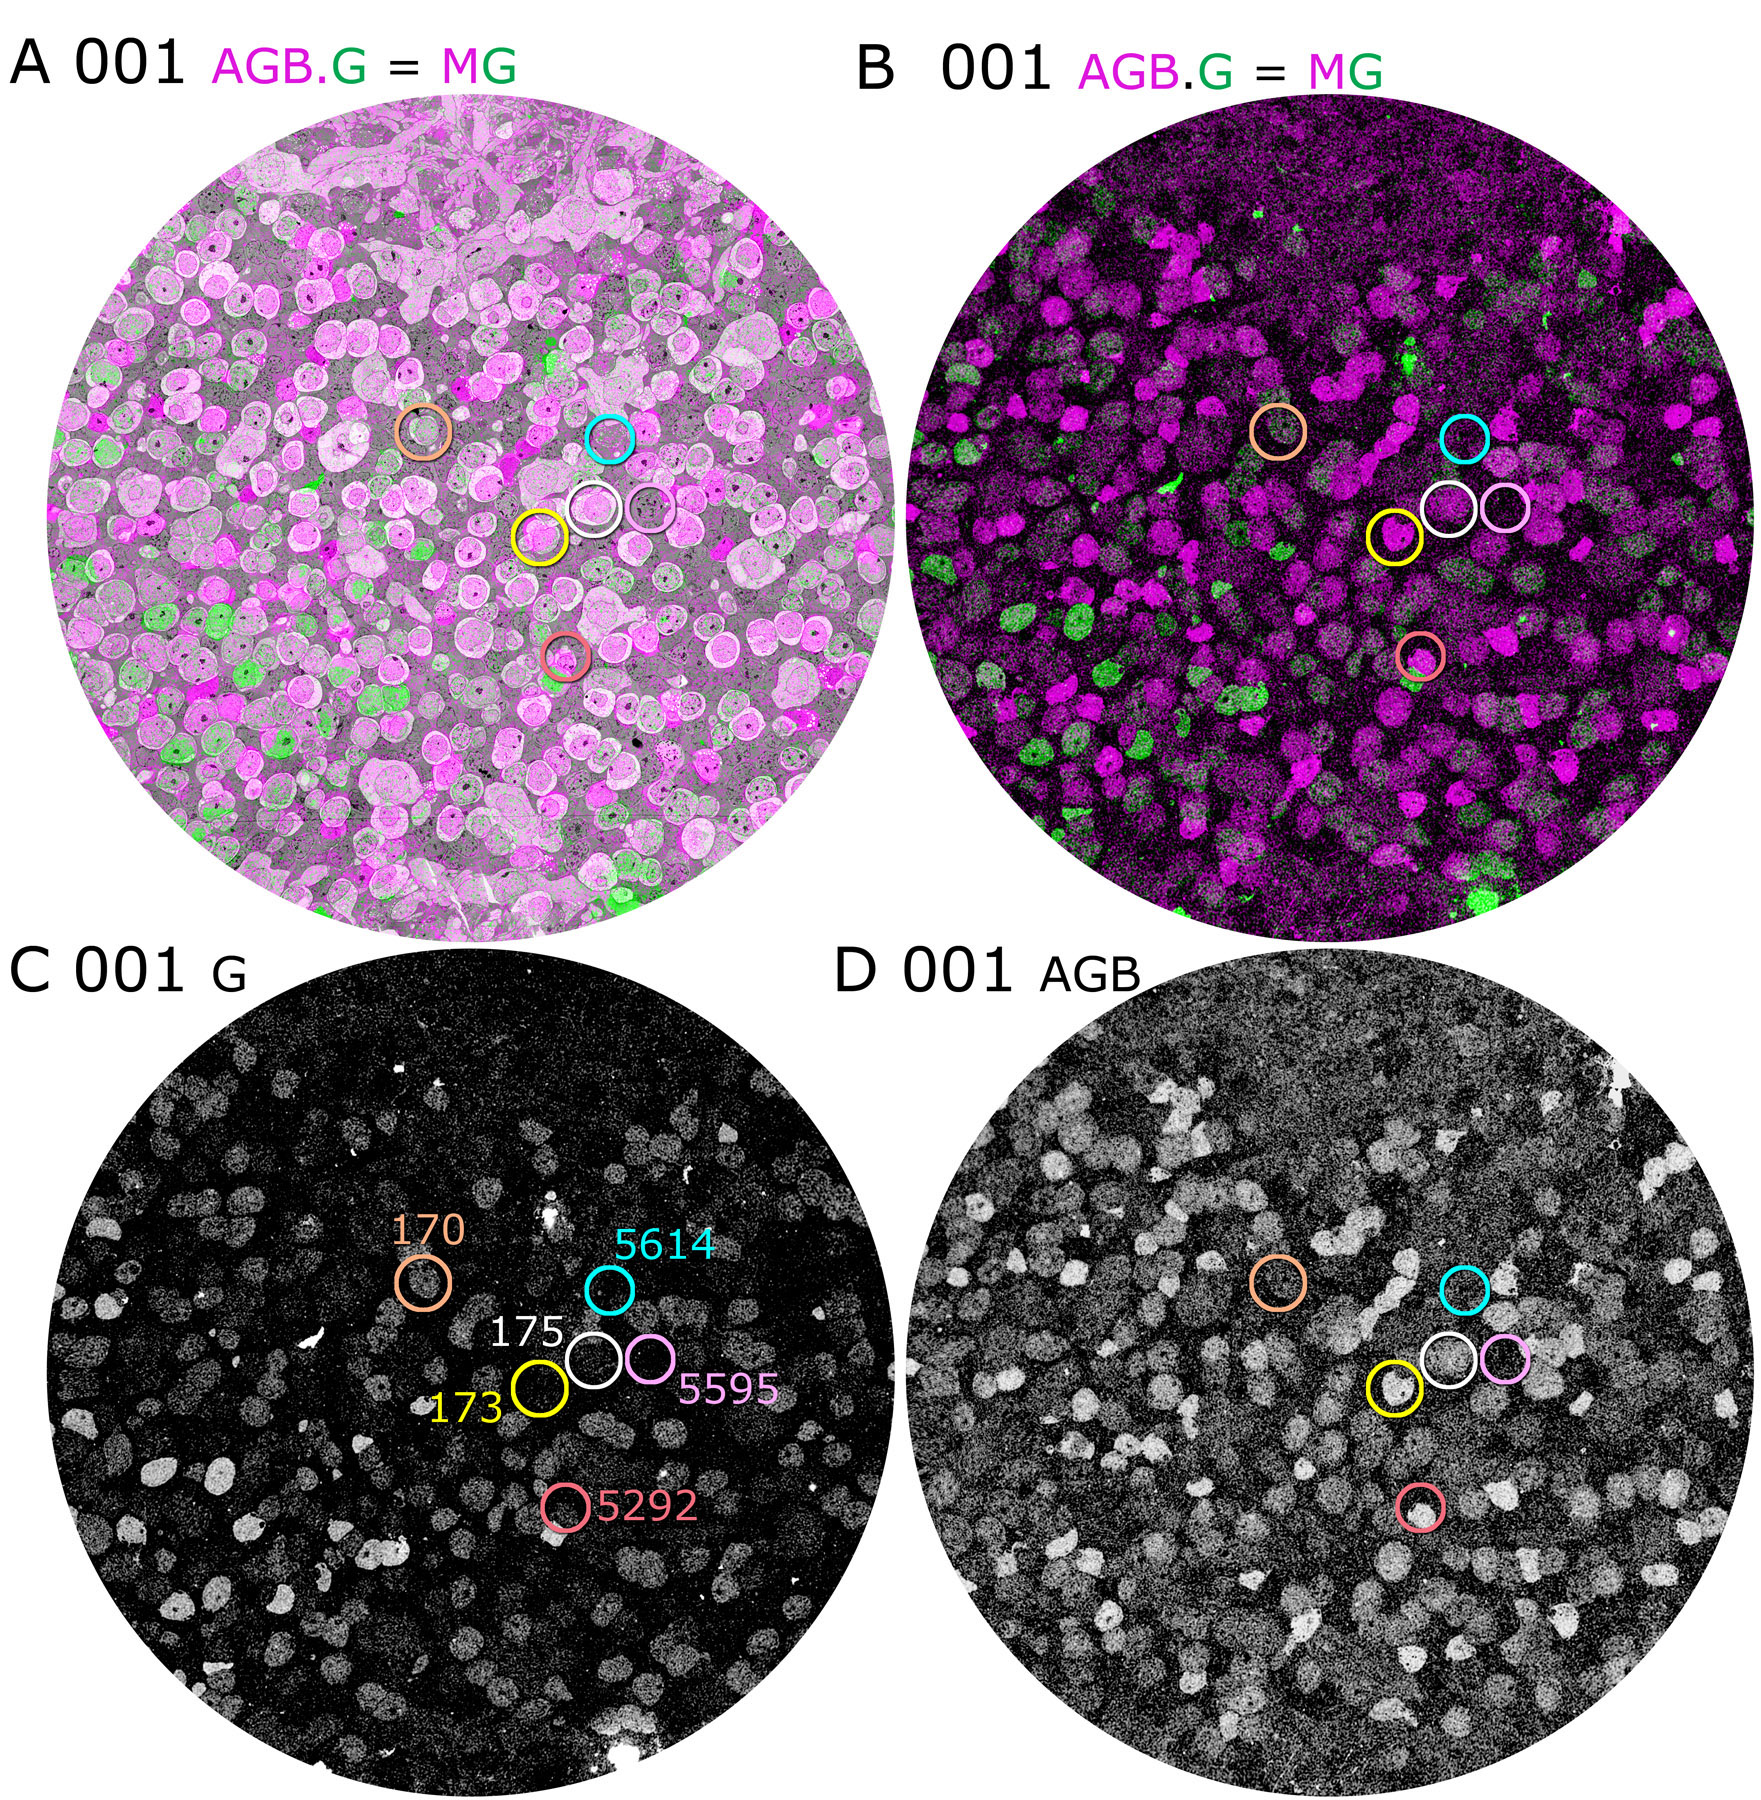
 Figure 16 of Anderson, Mol Vis 2011; 17:355-379.