Figure 13. AI and AII amacrine cells
display complex networks. A: Transmission electron microscope
(TEM) section 062 shows γ+ AI AC 4943 and neighboring BCs and ACs
(green) with a magenta GABA overlay. B: γ+ AI amacrine cell
4943 (red) spans the width of the RC1 volume and some of the cells
associated with it are rod bipolar cells 518, 5923, 8586; OFF cone
bipolar cell 5539; G+ AII amacrine cell, 476; G+ OFF amacrine cell,
7188. The circles over the proximal dendrites of amacrine cell 4943
denote sites of multiple amacrine cell synaptic inputs. C: Rod
bipolar cell 8586 synapses onto AI AC 4943. D: AI AC 4943 onto
synapses rod bipolar cell 5923. E: G+ AC 7188 makes a conventional
synapse on AI AC 4943. F: AI AC 4943 receives serial
conventional synapses. E denotes glutamate; G denotes glycine. The
letter colors match the profiles in the image. The main panel is from
section 168 and the yellow panel insert is from section 165.
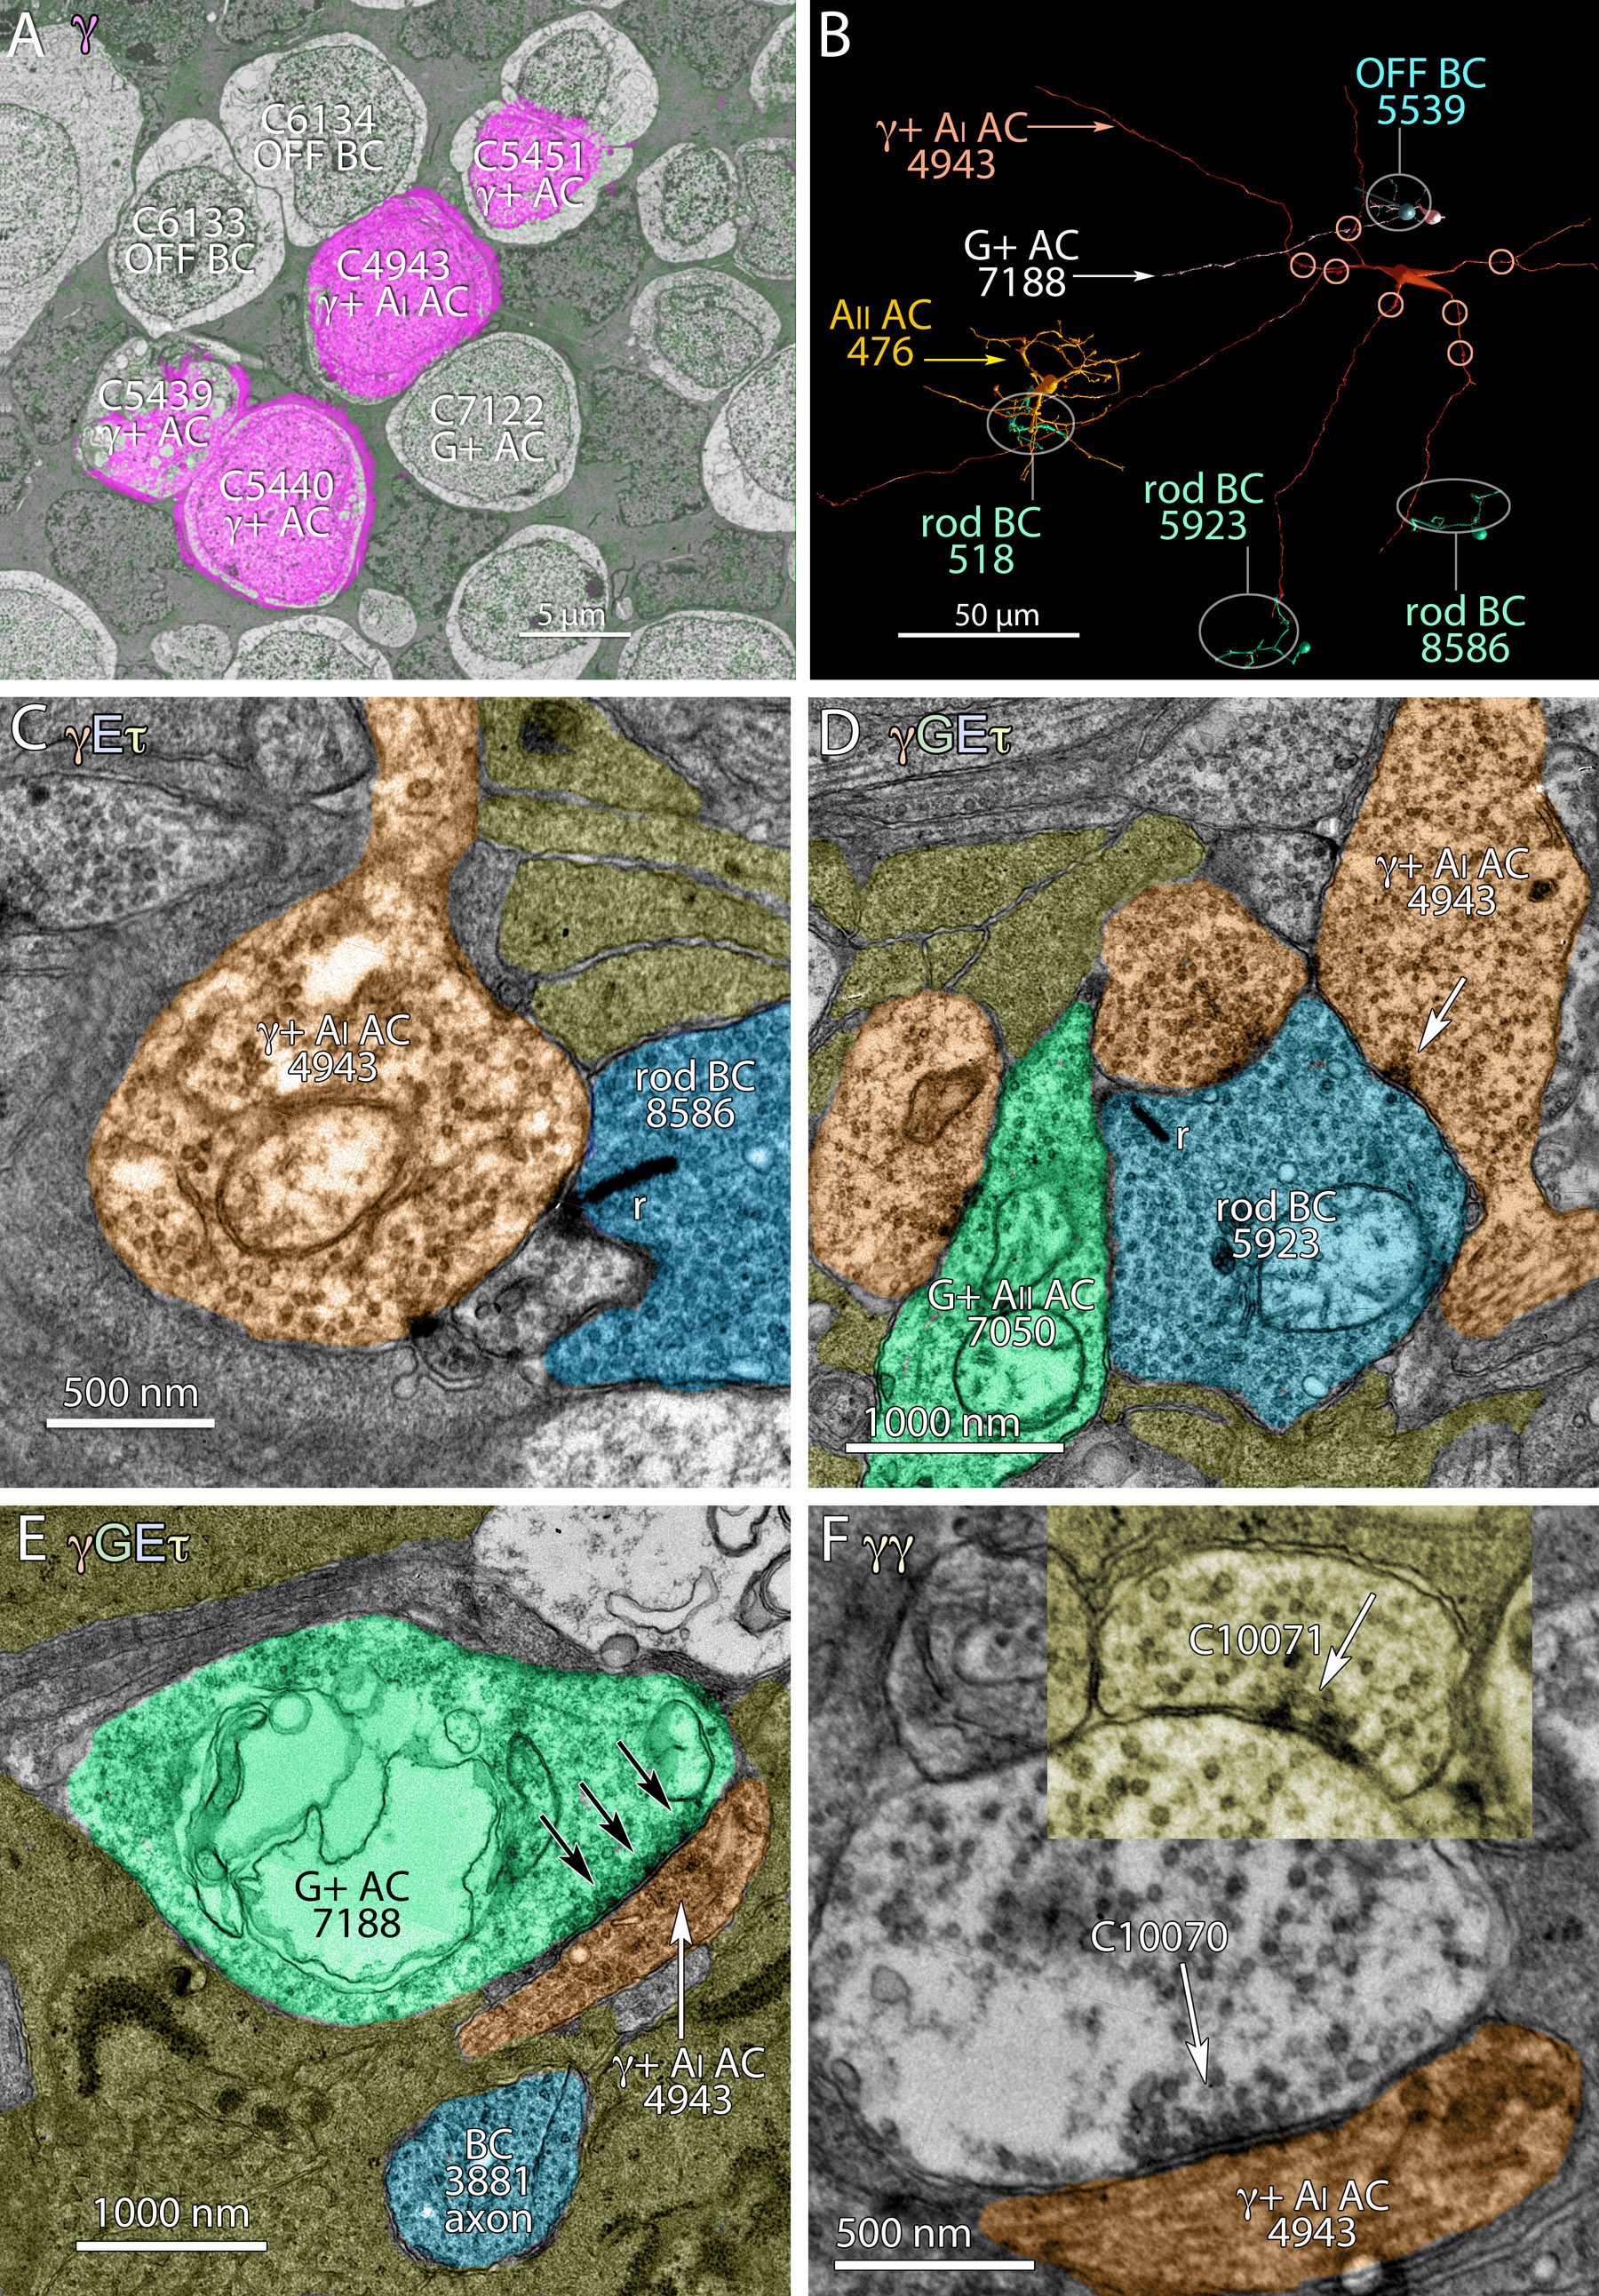
 Figure 13 of Anderson, Mol Vis 2011; 17:355-379.