Figure 1. The vertical bars represent
section structure of the 0.25 mm diameter column of 341 transmission
electron microscope (TEM) data set slices in volume RC1, imaged at 2 nm
resolution. The horizontal bars represent capstone and individual
intercalated computational molecular phenotyping (CMP) sections for
molecular tagging. CMP images were captured at 70 nm/pixel and
upsampled to 2.18 nm/pixel in Viking. The CMP skips in the TEM sequence
were intentional and created no problems in process tracking. The gaps
indicate unplanned capture skips in due to defects that prevented
imaging. A block refacing event at section 306 caused a significant
(350–400 nm) loss in the ganglion cell layer. At bottom, a single grid
carrying three imaged sections is shown. The gold spot on each section
indicates the area captured, each spot averaging over 1,000 individual
captures at a magnification of 5,000×.
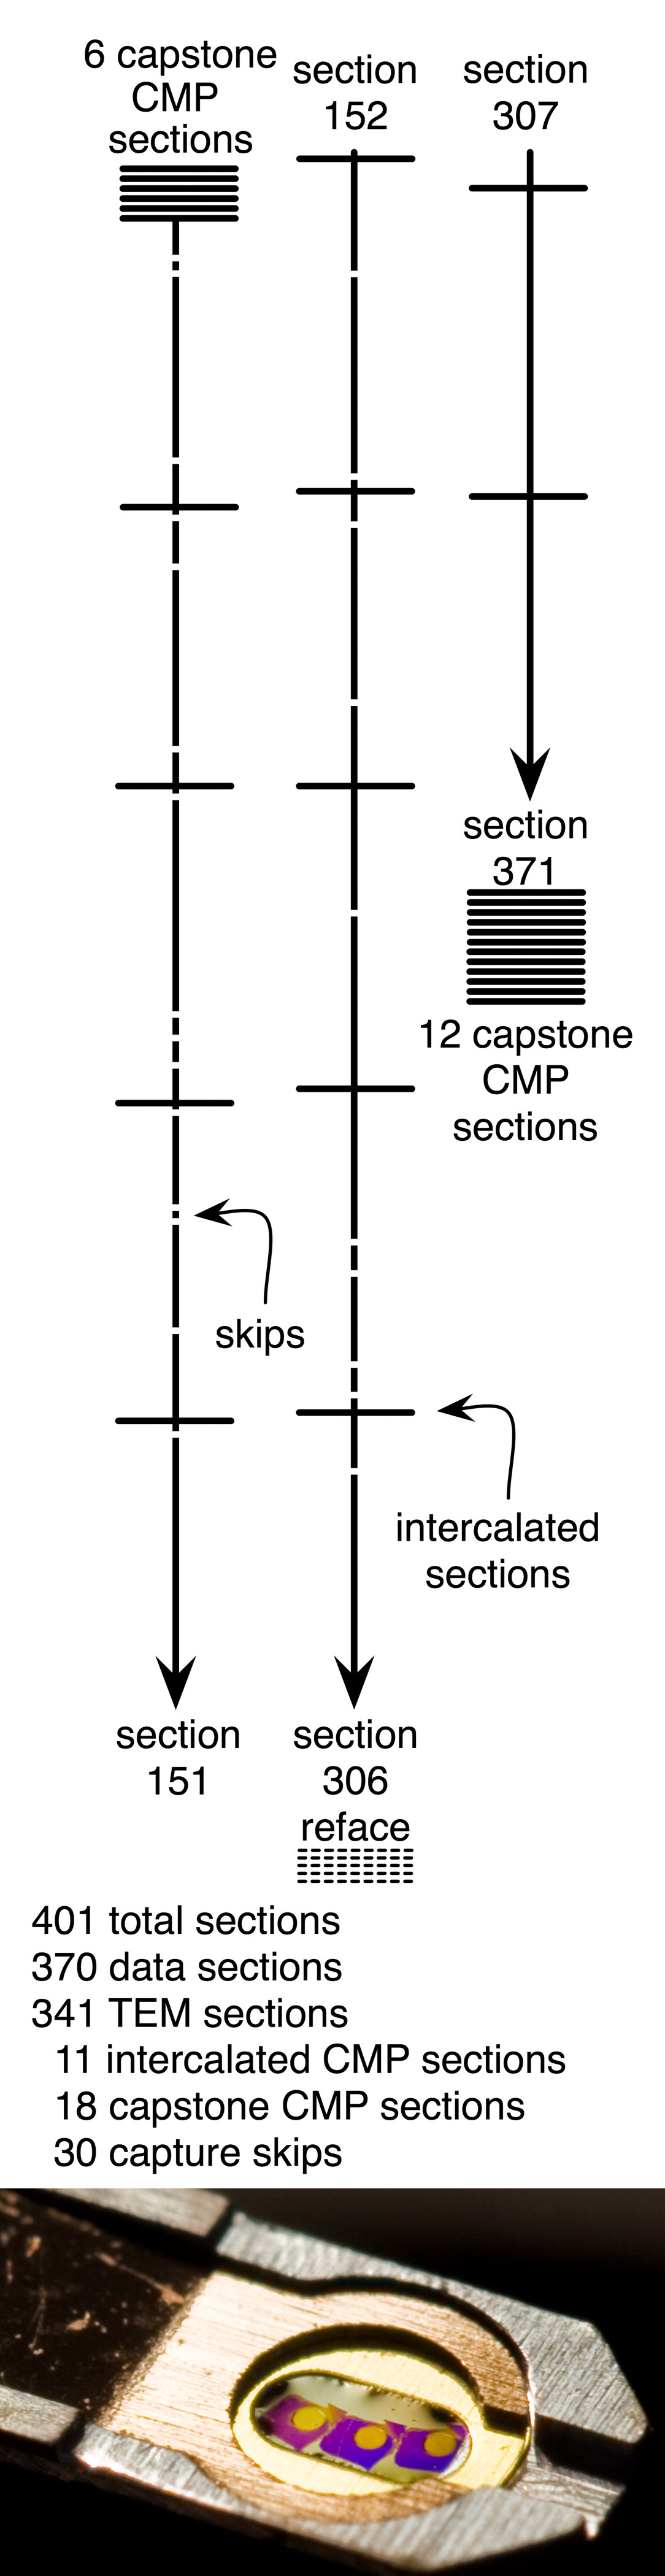
 Figure 1 of Anderson, Mol Vis 2011; 17:355-379.