Figure 7. Flow cytometry analysis of cultured cells. Single cell suspensions were analyzed according to their size (FSC) and granularity
(SSC) profiles. A representative dot-plot was shown for full thickness (A), superficial limbal explants (B), and stromal explants (C). R2: cells with a small size; R3: cells with a large size.
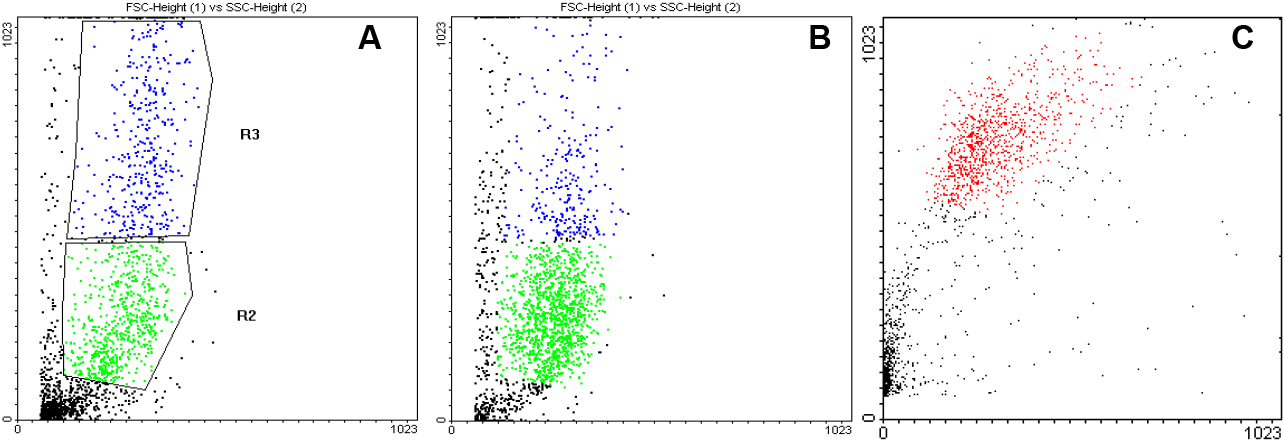
 Figure 7 of
Ghoubay-Benallaoua, Mol Vis 2011; 17:341-354.
Figure 7 of
Ghoubay-Benallaoua, Mol Vis 2011; 17:341-354.