Figure 2 of
Ghoubay-Benallaoua, Mol Vis 2011; 17:341-354.
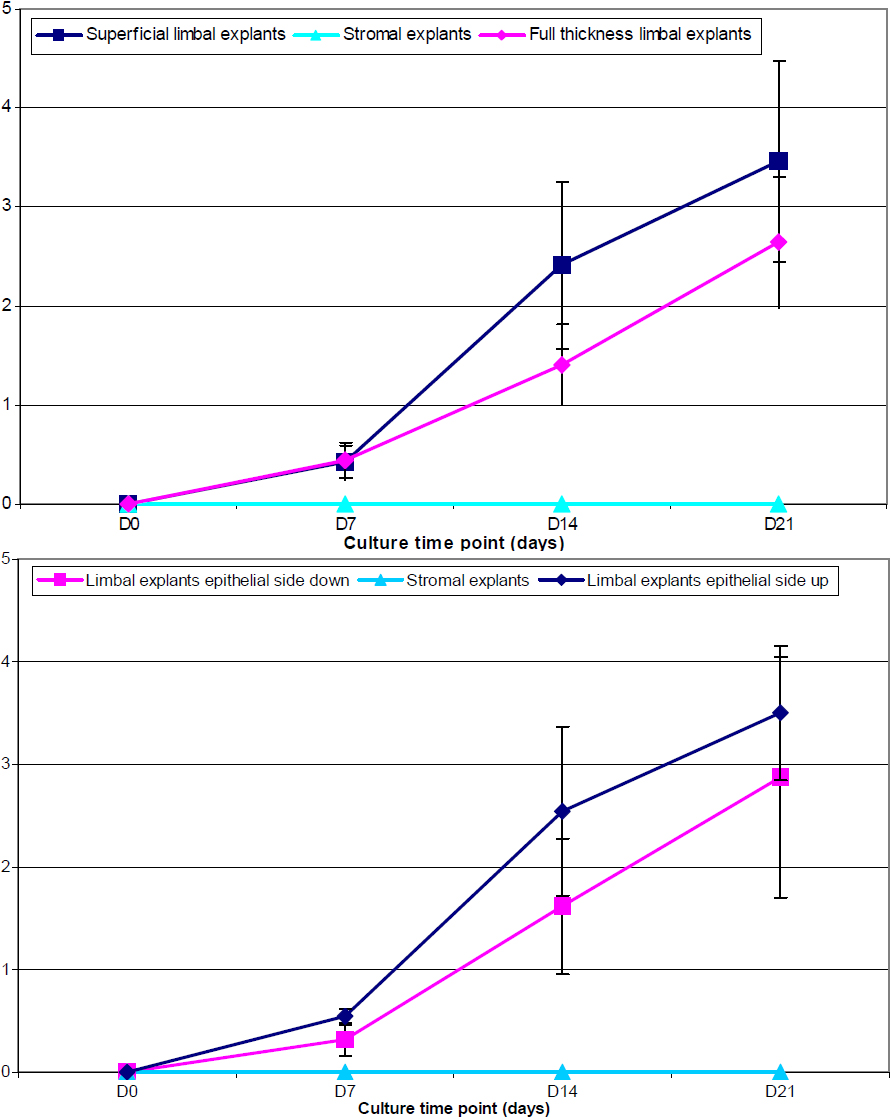
Figure 2.
Graphic representation of the evolution of the cell sheet area of human limbal explants and stromal explants.
 Figure 2 of
Ghoubay-Benallaoua, Mol Vis 2011; 17:341-354. Figure 2 of
Ghoubay-Benallaoua, Mol Vis 2011; 17:341-354.
Figure 2 of
Ghoubay-Benallaoua, Mol Vis 2011; 17:341-354. Figure 2 of
Ghoubay-Benallaoua, Mol Vis 2011; 17:341-354.