Figure 5. uPA mRNA in cultured normal conjunctival and pterygium fibroblasts of various stages measured by quantitative real-time PCR.
Comparison of uPA mRNA levels between normal conjunctiva and pterygium fibroblasts at various stages. Data are given as mean±SD (n=5). *Significant
difference (p<0.05) compared with normal. #Significant difference (p<0.05) compared with stage I. &Significant difference
(p<0.05) compared with stage II.
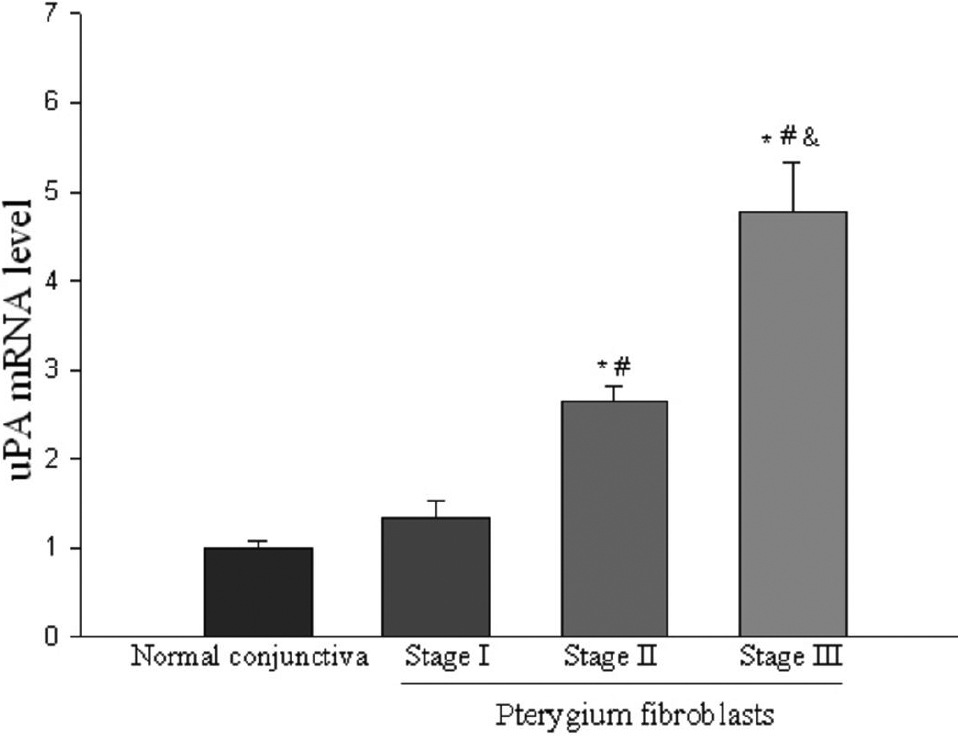
 Figure 5 of
Chao, Mol Vis 2011; 17:23-31.
Figure 5 of
Chao, Mol Vis 2011; 17:23-31.