Figure 2. uPA activities in normal conjunctival and pterygium tissues at various stages measured by casein zymography. A: uPA activity was analysis by casein zymography. The u-PA standard from ELISA kits by American Diagnostica was used as the
positive control (PC) and buffer was loaded alone as the negative control (NC). β-actin was used as an internal loading control
and analysis by western blotting. B: Comparison of uPA activity levels between normal conjunctival and pterygium tissues. Data are given as mean±SD *Significant
difference (p<0.05) between normal conjunctiva and pterygium. C: Levels of uPA in pterygium tissues at various stages. Data are given as mean±SD *Significant difference (p<0.05) compared
with stage I. #Significant difference (p<0.05) compared with stage II.
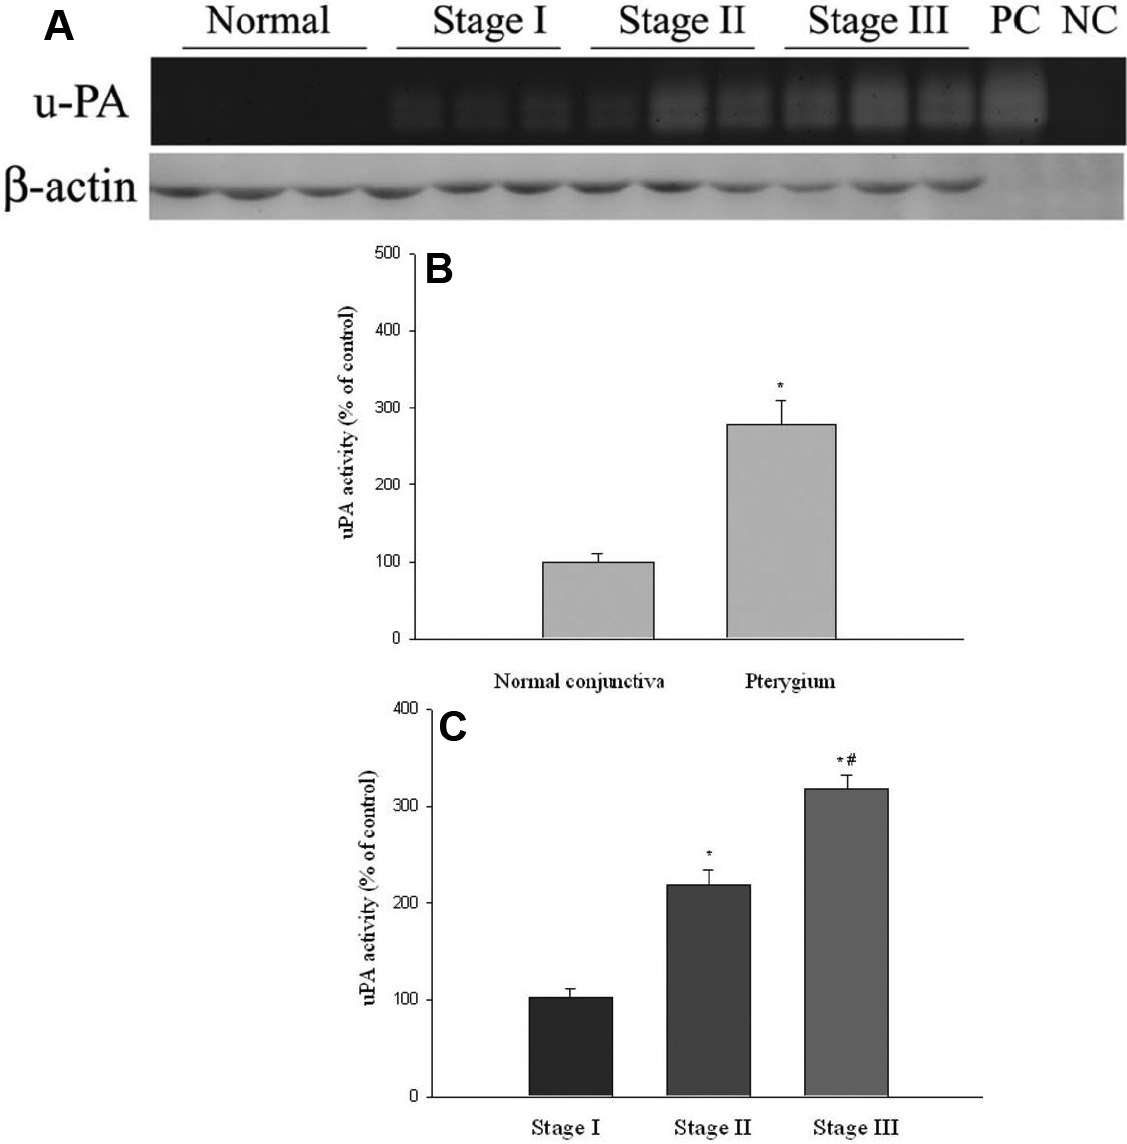
 Figure 2 of
Chao, Mol Vis 2011; 17:23-31.
Figure 2 of
Chao, Mol Vis 2011; 17:23-31.