Figure 1. Forest plot showing the
association between ARMS2 A69S and neovascular
age-related macular degeneration. Odds ratios (black squares)
and 95% confidence intervals (bars) are given for each study.
Also shown are the unshaded diamonds of the summary odds ratio
based on the Mantel–Haenszel fixed effects model.
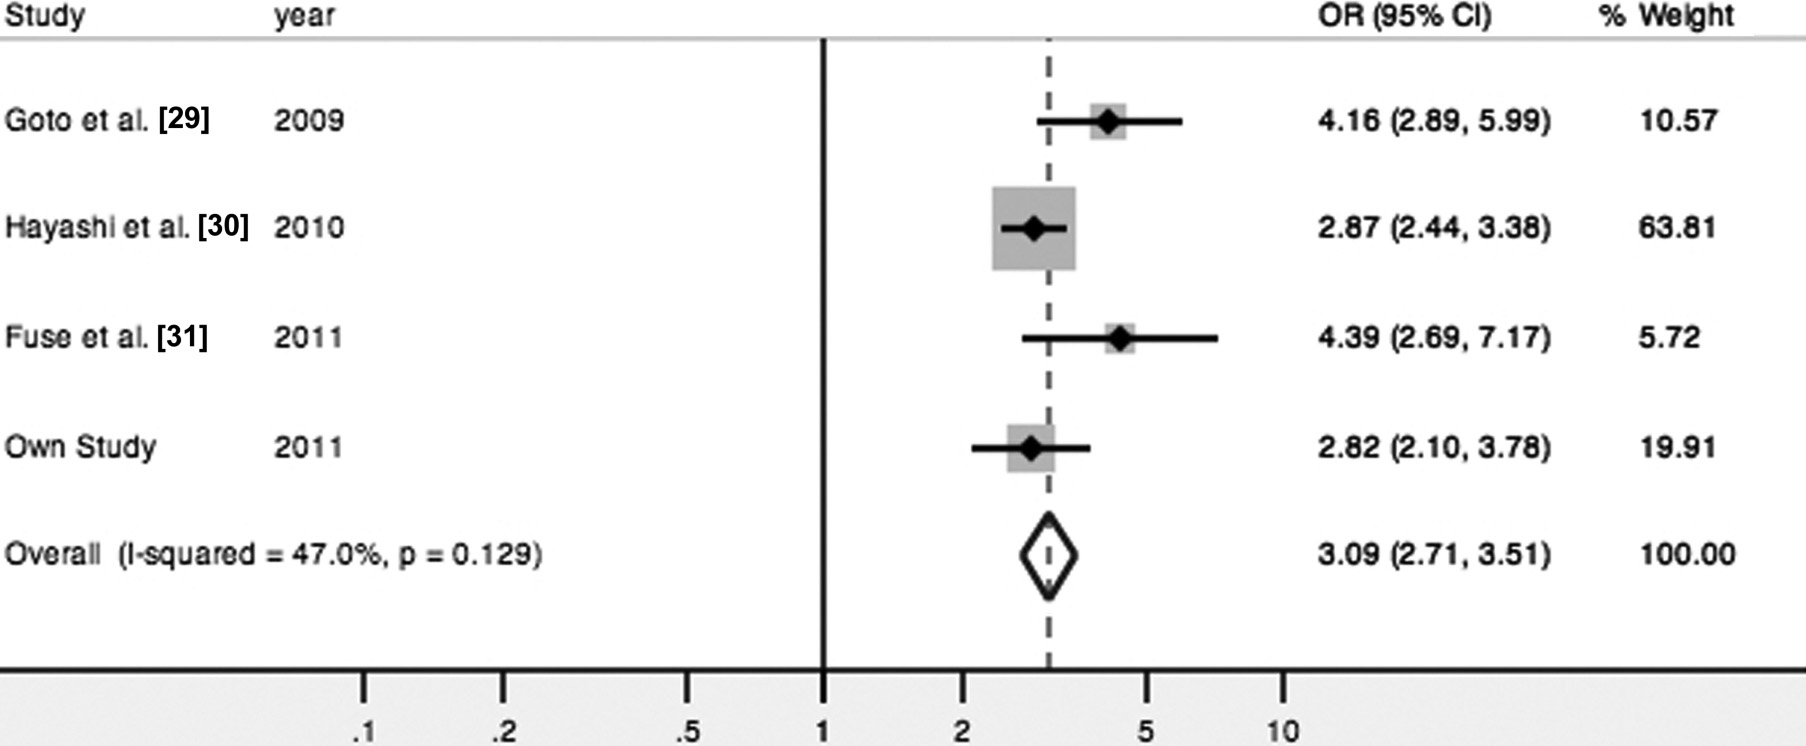
 Figure 1
of Yanagisawa, Mol Vis 2011; 17:3574-3582.
Figure 1
of Yanagisawa, Mol Vis 2011; 17:3574-3582.