Figure 1. Unoprostone and M1 suppressed H2O2-induced photoreceptor cell death. A: Representative fluorescence microscopic images showing nuclear staining for Hoechst 33342 and PI after 24 h H2O2 treatment. Unoprostone (0.01–1 µM), M1 (0.01–1 µM), PGF2α (1 µM), and latanoprost (1 µM) or trolox (100 µM) were added 1 h before H2O2 treatment. B: The number of cells exhibiting PI fluorescence was counted, and expressed as the percentage of PI positive cells to Hoechst
33342 positive cells. Data are expressed as mean±SEM (n=6). * p<0.05, ** p<0.01 versus vehicle; ## p<0.01 versus control (Dunnett’s test). Con: control; Veh: vehicle; Lat: latanoprost; Tro: trolox. Scale bar represents 100
µm.
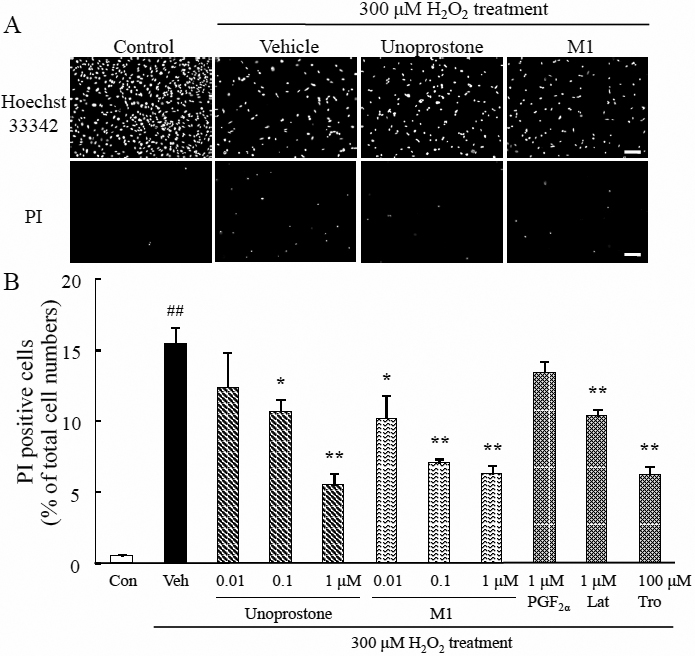
 Figure 1 of
Tsuruma, Mol Vis 2011; 17:3556-3565.
Figure 1 of
Tsuruma, Mol Vis 2011; 17:3556-3565.