Figure 4. Western blot analysis of
decreasing expression of LF and increasing expression of VMO1 homolog
in camel tears in the summer compared to the winter. A, B:
Comparison
of expression of LF (A) and VMO1 homolog (B)
between the summer group (Cs) and the winter group (Cw) by western
blotting. C, D: Relative quantitative analysis of each
corresponding band of LF (C) and VMO1 homolog (D) in two
groups, based on the volume intensity of the band in Cw as 1.0. The
paired student’s t test was performed and showed a significant
difference (*p=0.042, **p=0.002) between two groups.
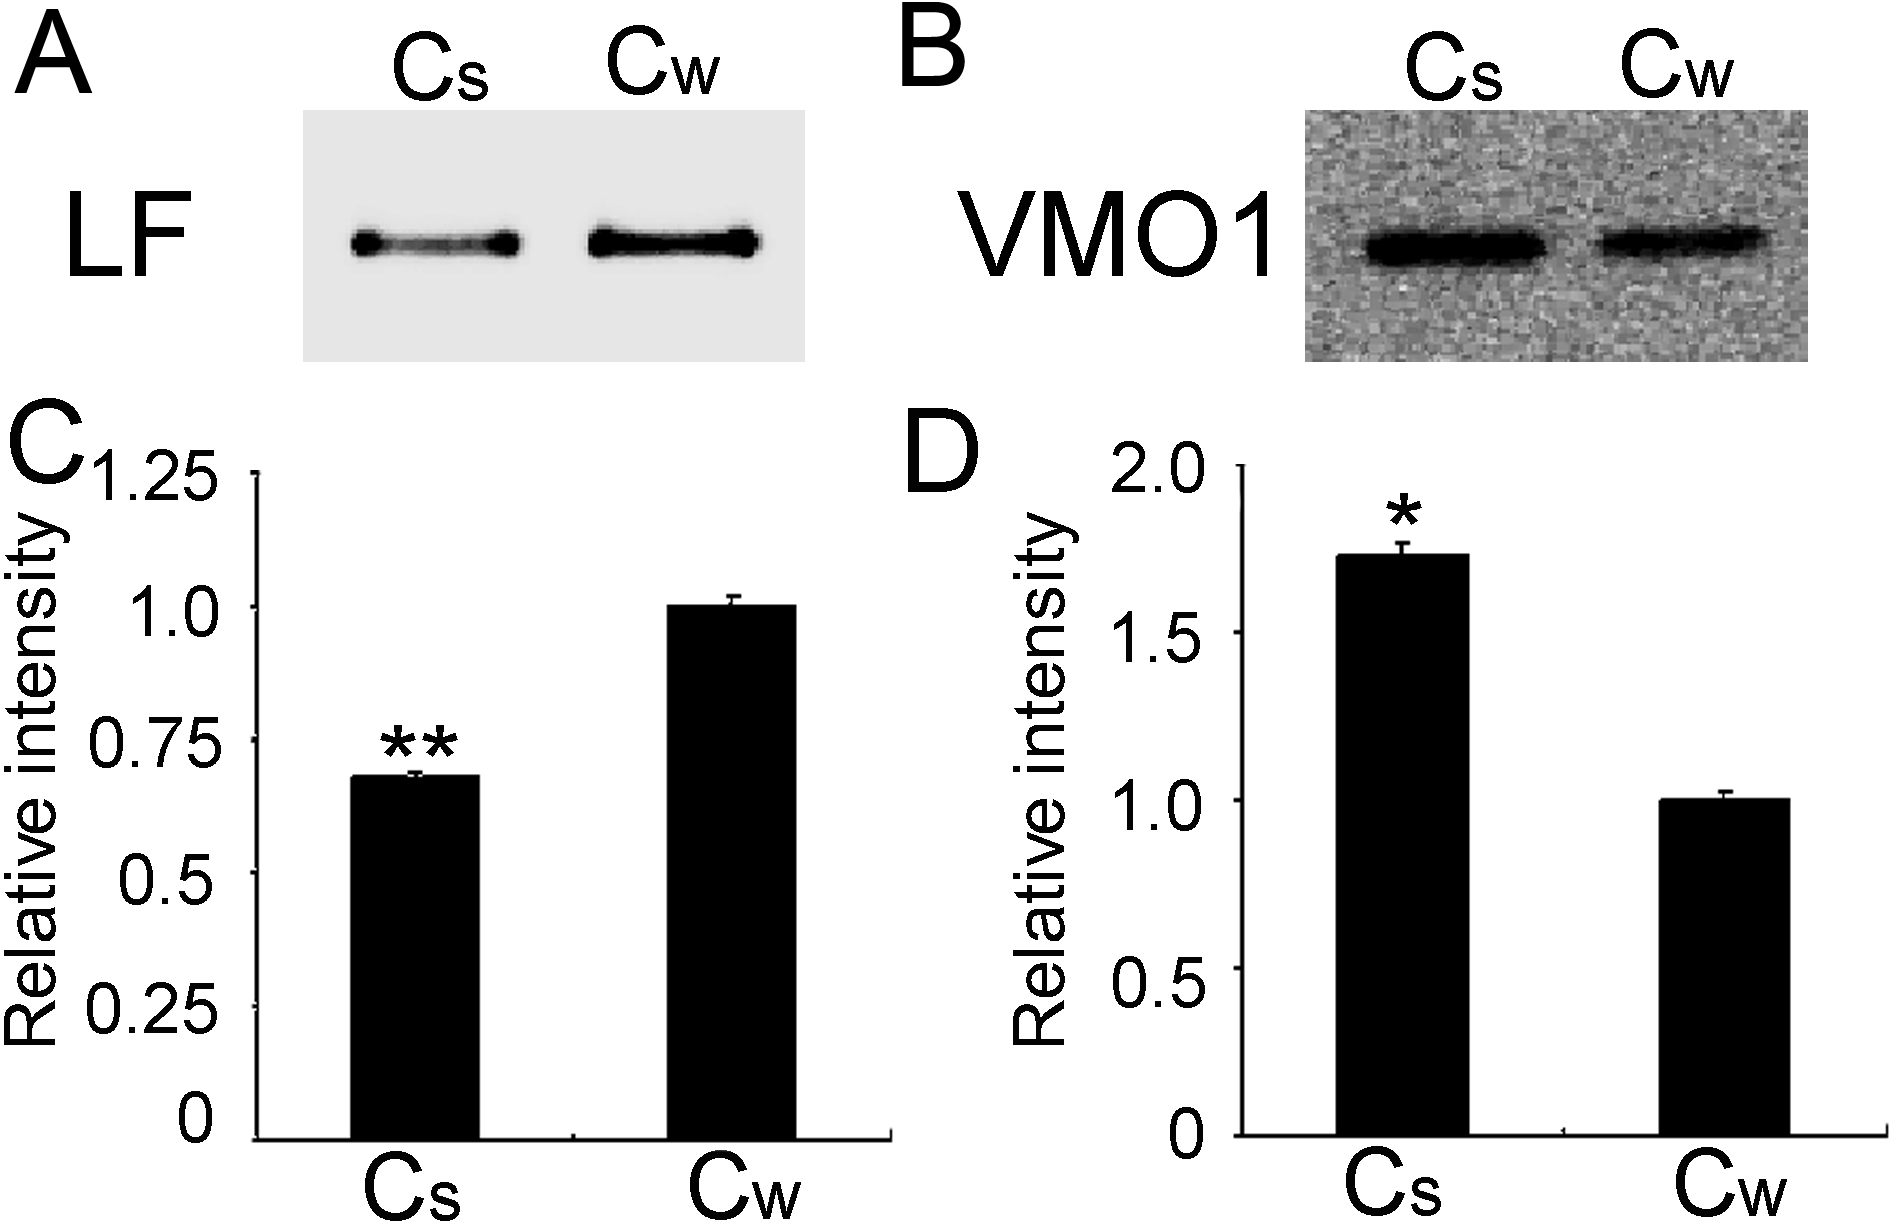
 Figure 4 of Chen, Mol Vis 2011; 17:323-331.