Figure 4. Paeoniflorin (PF) inhibits
H2O2-induced reactive oxygen species (ROS)
production in ARPE-19 cells. A: APRE-19 cells were
treated with different concentrations of H2O2
(50–800 μM). For measuring H2O2
production, the cells were then labeled with
2’,7’-dichlorodihydrofluorescein diacetate (H2DCFDA).
Quantitative analysis was performed by measuring fluorescence
intensity. Each value represents the mean±SEM of three
independent experiments (n=3 experiments, *p<0.05). B:
ARPE-19 cells were treated with 200 μM H2O2
and different concentrations of PF (50–200 μg/ml). For measuring
H2O2 production, the cells were then
labeled with H2DCFDA. Quantitative analysis was
performed by measuring the fluorescence intensity relative to
the control. Each value represents the mean±SEM of three
independent experiments (n=3 experiments, *p<0.05). C:
For measuring H2O2 production, the cells
were labeled with H2DCFDA. Figures were selected as
representative data from three independent experiments. Scale
bar, 100 μm.
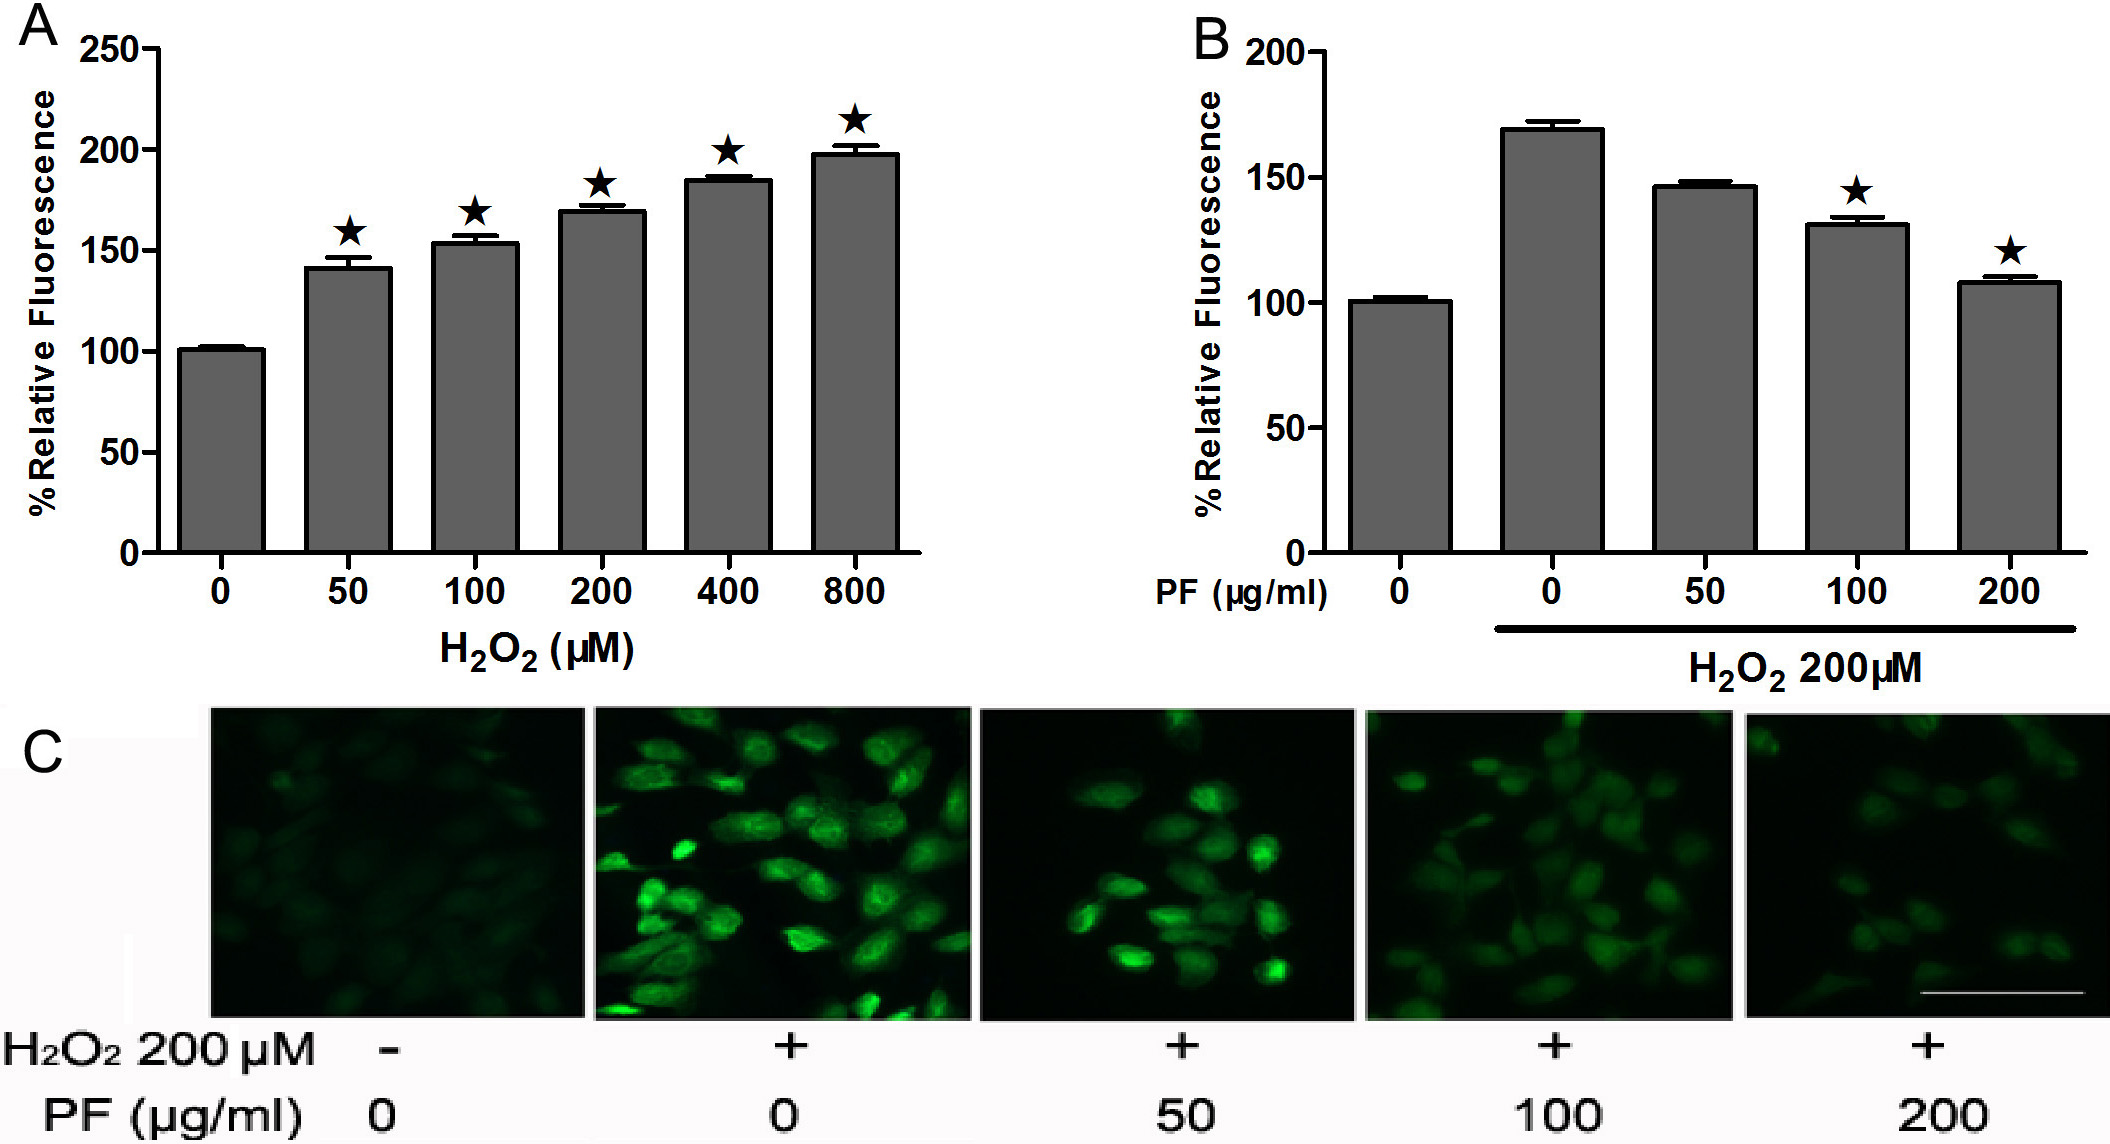
 Figure 4
of Wankun, Mol Vis 2011; 17:3512-3522.
Figure 4
of Wankun, Mol Vis 2011; 17:3512-3522.