Figure 2. DR3 mRNA and protein levels in CD4+ T cells from experimental autoimmune uveitis (EAU) increased. A: Real-time PCR analysis of DR3 mRNA expression in CD4+ T cells isolated from the control, EAU, or recovery phase mice. GAPDH mRNA was used as a control to normalize the total mRNA levels. * indicates p<0.05 when compared day 7 with day 21 in the
EAU group. B: western blotting analysis of DR3 protein expression in the CD4+ T cells. β-Actin was used as a loading control. C: Densitometry quantification of western-blotting results in panel B. * indicates p<0.05 when day 7 is compared with day 21 in the EAU group. Each value represents the mean±SD (n=6).
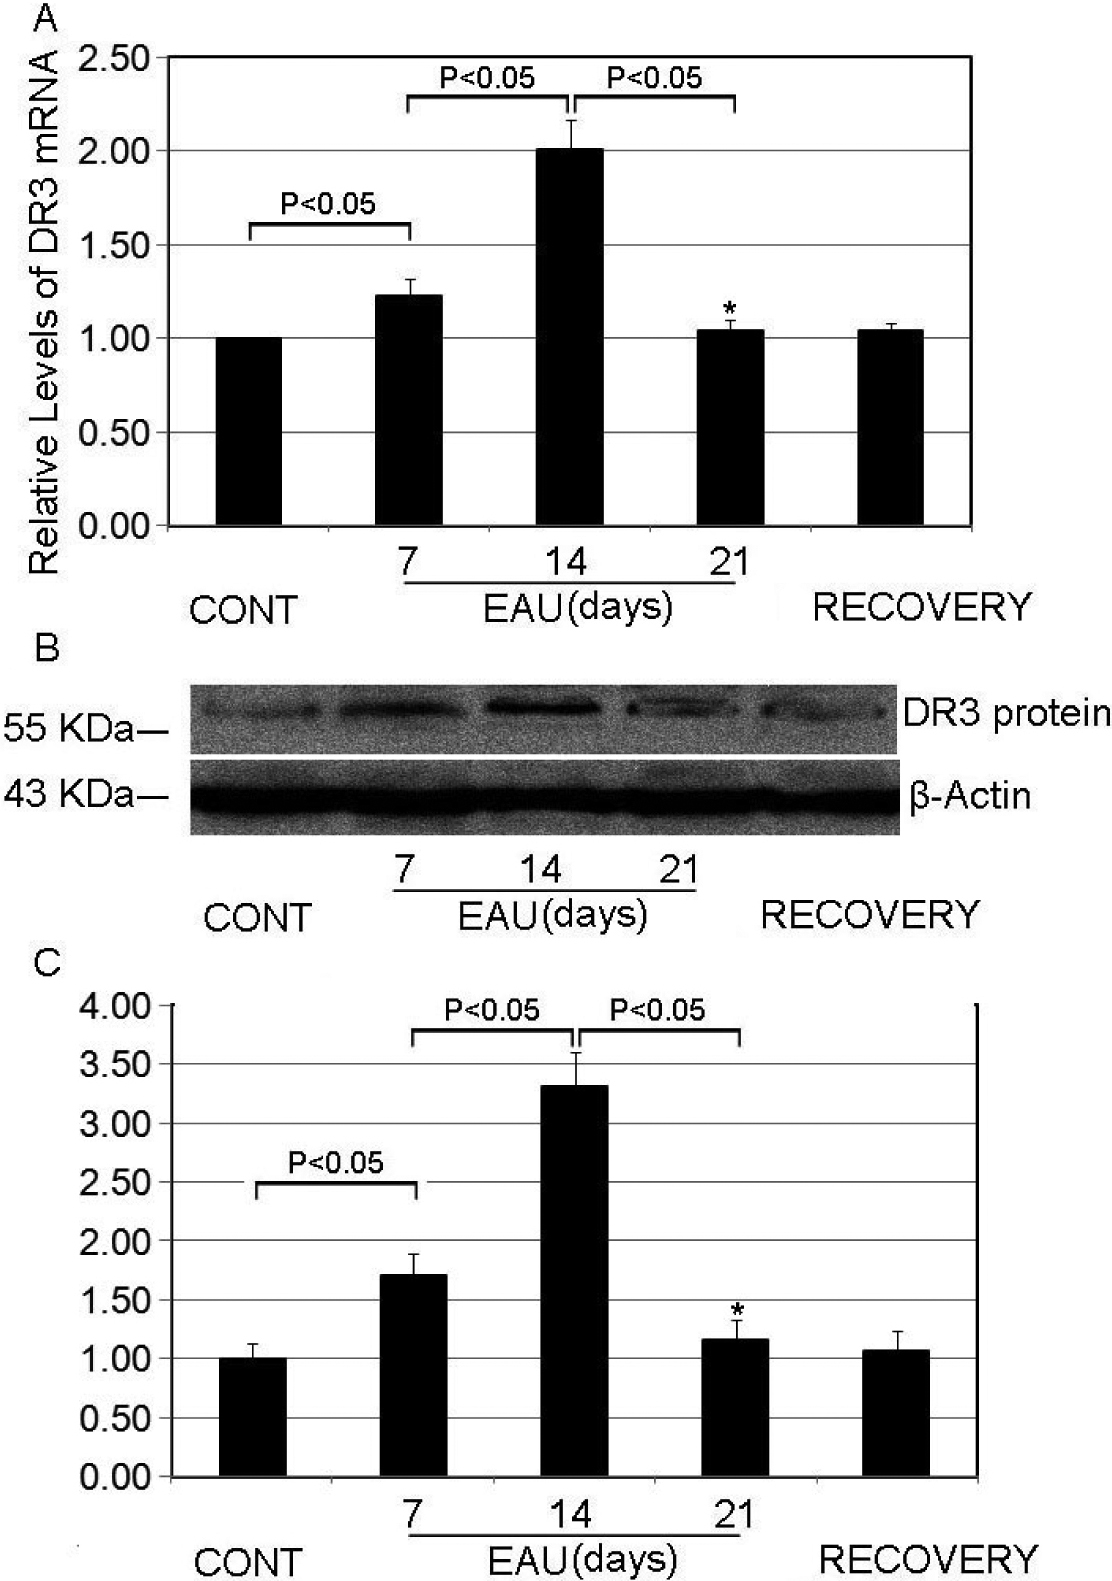
 Figure 2 of
Qin, Mol Vis 2011; 17:3486-3493.
Figure 2 of
Qin, Mol Vis 2011; 17:3486-3493.