Figure 4. Lymphocytes and macrophages scattered throughout the pterygium. Immunohistochemistry using anti-leukocyte common antigen (LCA),
anti-CD3, and anti-CD68 antibodies showed the characteristic distribution of inflammatory cells. A-C: Tissue image was obtained from case 4. D-F: Tissue image was obtained from case 8. LCA and CD3 staining showed a similar clustered distribution, suggesting most LCA-expressing
cells are T cells. CD68-expressing cells are smaller in population and have an evenly scattered distribution.
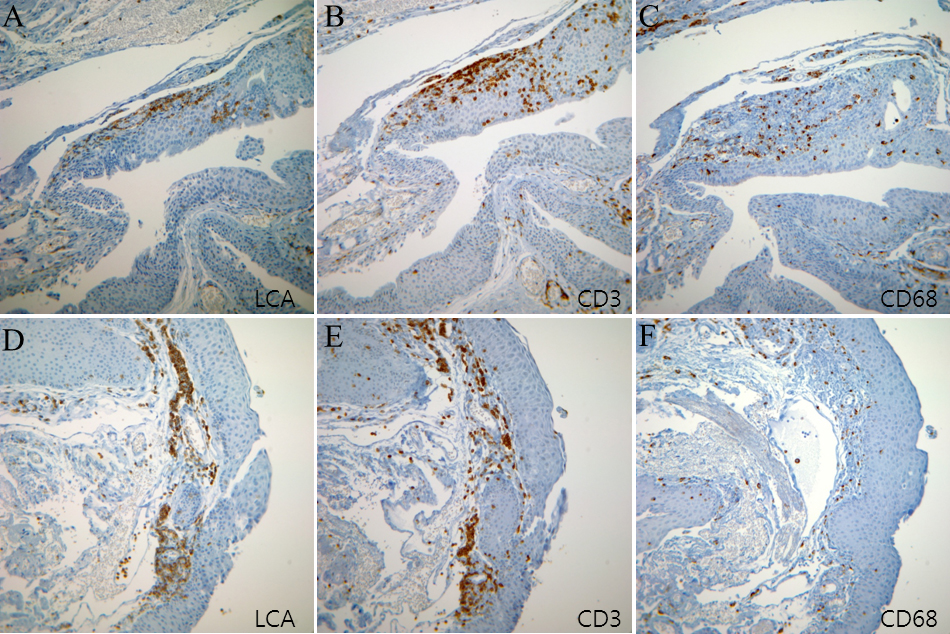
 Figure 4 of
Park, Mol Vis 2011; 17:3468-3480.
Figure 4 of
Park, Mol Vis 2011; 17:3468-3480.