Figure 3. The various patterns of cyclooxygenase-2 expression in human pterygium. Panels A to C demonstrate score 0 (A, case 13), score ++ (B, case 1) and score +++ (C, case 16) expression of cyclooxygenase-2 (COX-2) in the epithelial layer of pterygium. Strong COX-2-expressing stromal cells
were always observed. D: A few COX-2-expressing cells were found within a cluster of inflammatory cells in case 4. E: These inflammatory cells were mostly CD3-expressing T cells. F: The epithelial layer of panel C shows a few, scattered, strong COX-2-expressing cells. G: COX-2-expressing cells in panel B were magnified. These cells were found near blood vessels; however, endothelial cells were negative for COX-2 expression.
Three cells show very strong positive COX-2 expression both in the cytoplasm and in the nucleus. H: Strong COX-2-expressing cells were localized within microvessels (case 15). The arrow indicates the magnified area. I: Inflammatory cells within vessels show segmented nuclei; however, these cells were negative for COX-2 expression (inserted
image). A few endothelial cells express COX-2 (case 6). COX-2 expression in the epithelial layer was scored for the percentage
of positive-staining cells: 0, negative staining; +, from 1 to 10%; ++, from 11 to 50%; and +++, more than 50% positive cells.
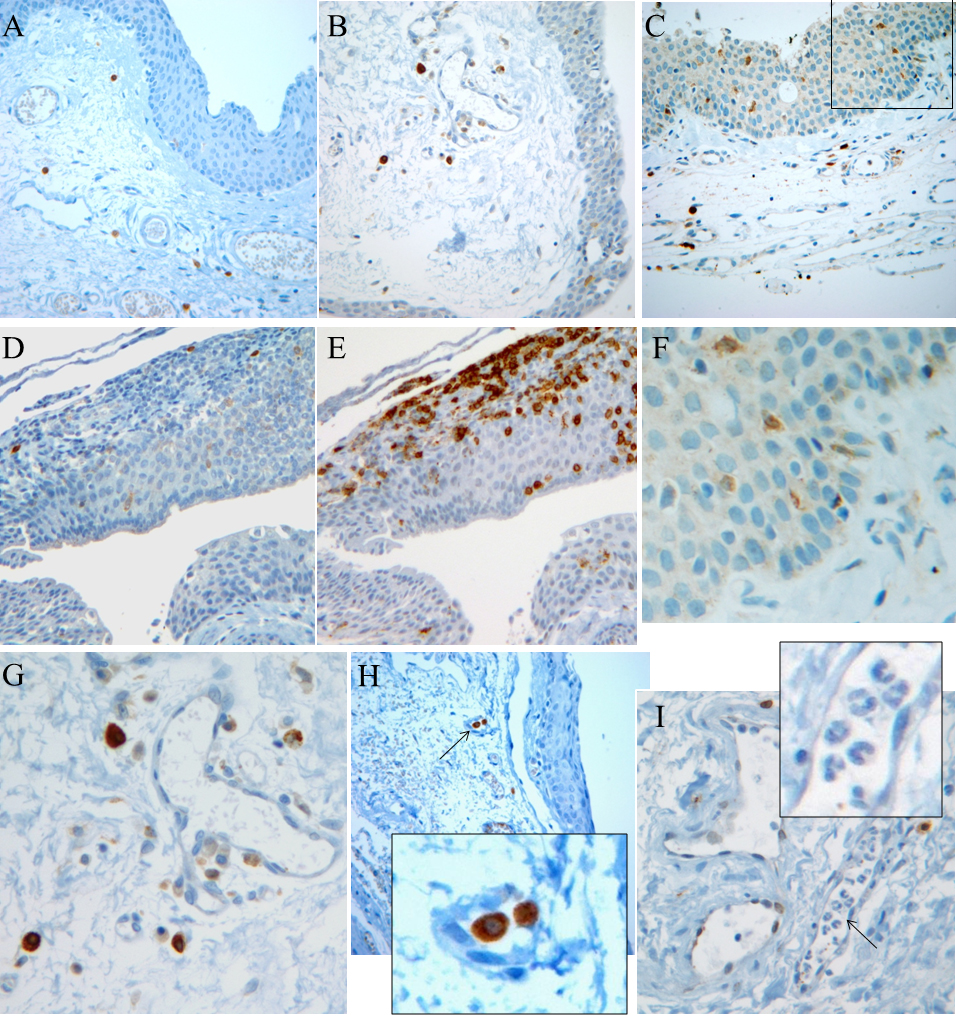
 Figure 3 of
Park, Mol Vis 2011; 17:3468-3480.
Figure 3 of
Park, Mol Vis 2011; 17:3468-3480.