Figure 5. Fundoscopy, autofluorescence and
optical coherence tomography (OCT3) imaging of a severely affected
patient (III-4). Typical vitelliform lesions are visible on the
ophthalmoscopic appearance of the right eye (A, B, C)
and
left eye shows fragmented vitelliform lesions (D, E,
F). Green lines indicate abrupt transitions and the frame of the
fundus that was scanned by optical coherent tomography (OCT). The
middle green lines of (A, D) indicate the horizontal
axis of the OCT scan shown in (C, F).
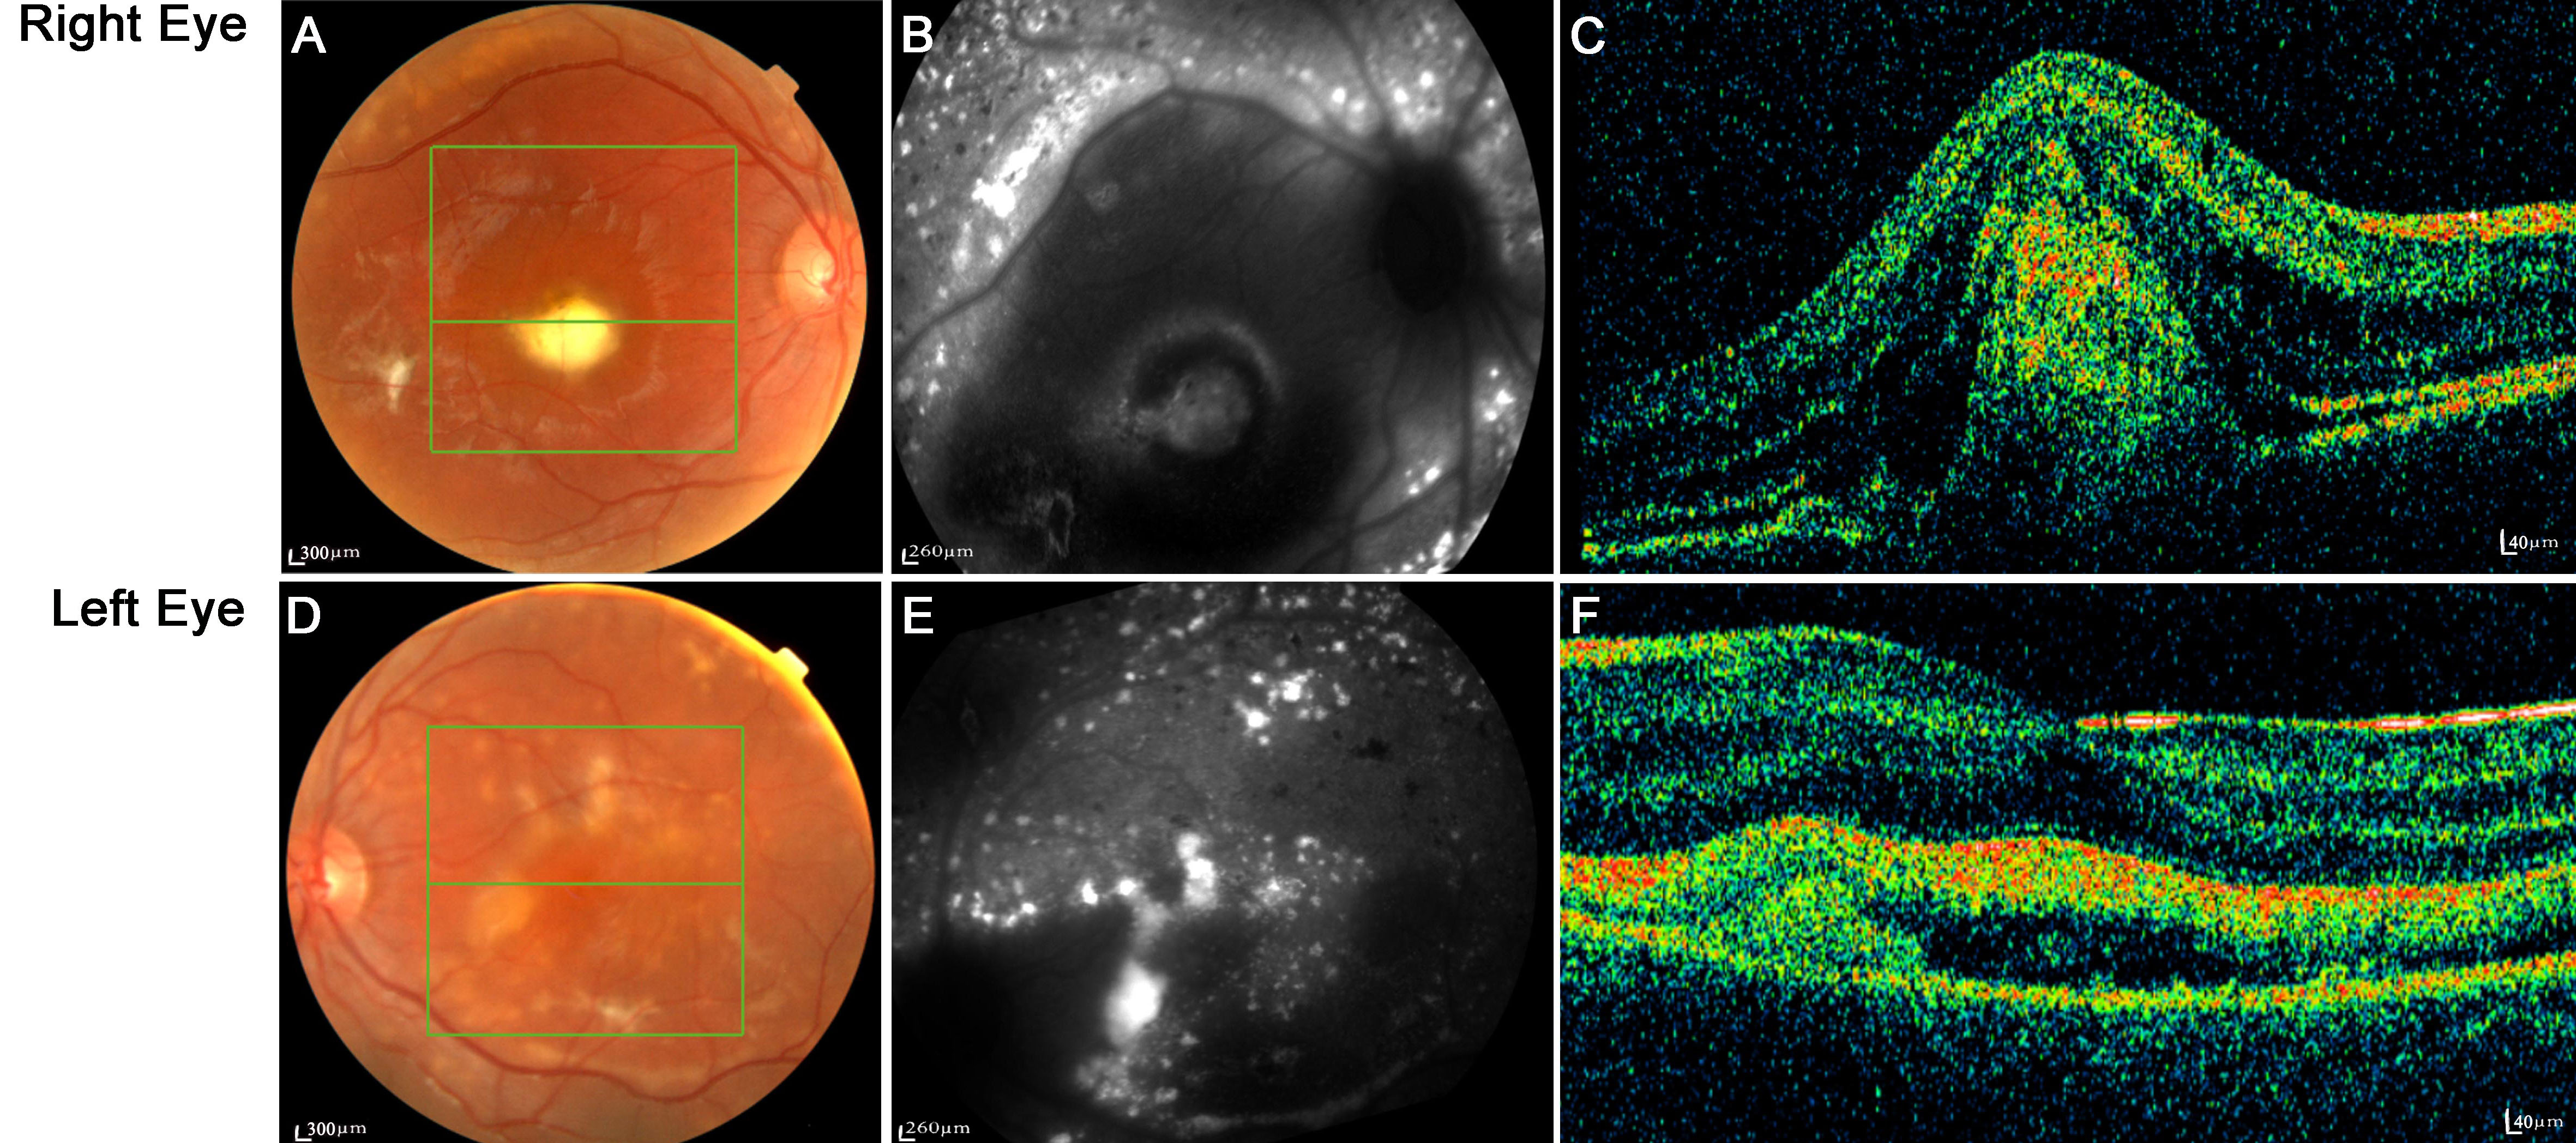
 Figure 5 of Lacassagne, Mol Vis 2011; 17:309-322.