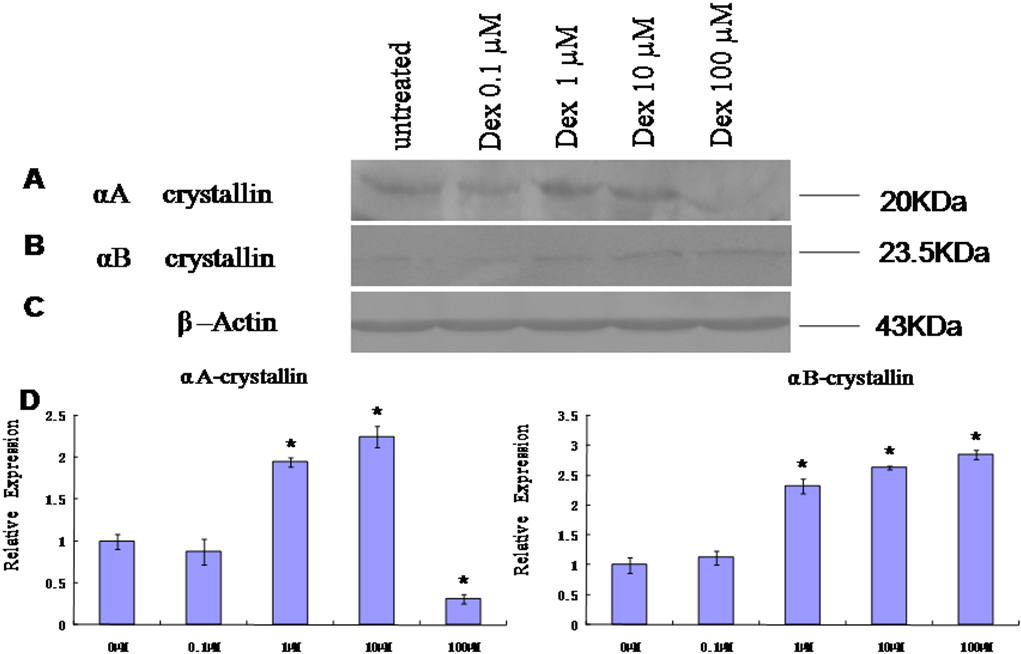
Figure 5. Protein levels of αA-crystalline and αB-crystallin.
A: western blot of protein samples (60 mg) prepared from the normal and Dex-exposed lenses. The blots were probed with anti-αA-crystallin
monoclonal antibodies.
B: Blots probed with anti-αB-crystallin polyclonal antibodies FL-175. The approximate sizes of αA-crystallin and αB-crystallin
are 20 kDa and 23.5 kDa, respectively. Imaging as described above, and densitometric scans for blot analysis were performed
using
NIH Image (ver.1.63) with values normalized to the β-actin signal for each sample and expressed as multiples of increase (or decrease)
relative to control samples. The expression of αA- and αB- crystallin were significantly increased when lenses were exposed
to 1 µM and 10 µM Dex (p<0.05, n=3). The expression of αA-crystallin was significantly decreased when lenses were exposed
to 100 µM Dex (densitometric scans of blots were decreased; p<0.05, n=3). Data are the means of three western blot experiments,
each performed in triplicate, and the pictures are representative.
 Figure 5 of
Wang, Mol Vis 2011; 17:3423-3436.
Figure 5 of
Wang, Mol Vis 2011; 17:3423-3436.