Figure 3. 2DE images and three dimensional views of protein spots with significantly different levels; 2DE images, the corresponding
three-dimensional views, and histograms of the spots were presented. Intensities of protein spots that increased were marked
with a red outline. Decreased were marked with a blue outline, and no significant changes were marked with a black outline.
The spots were identified as follows: αA-crystallin (spot 9), αB-crystallin (spot 16), βA3-crystallin (spot 14), βB2-crystallin
(spot 4), βA1-crystallin (spot 3), βA4-crystallin (spot 2), βB1-crystallin (spot 1; *p<0.05, n=3).
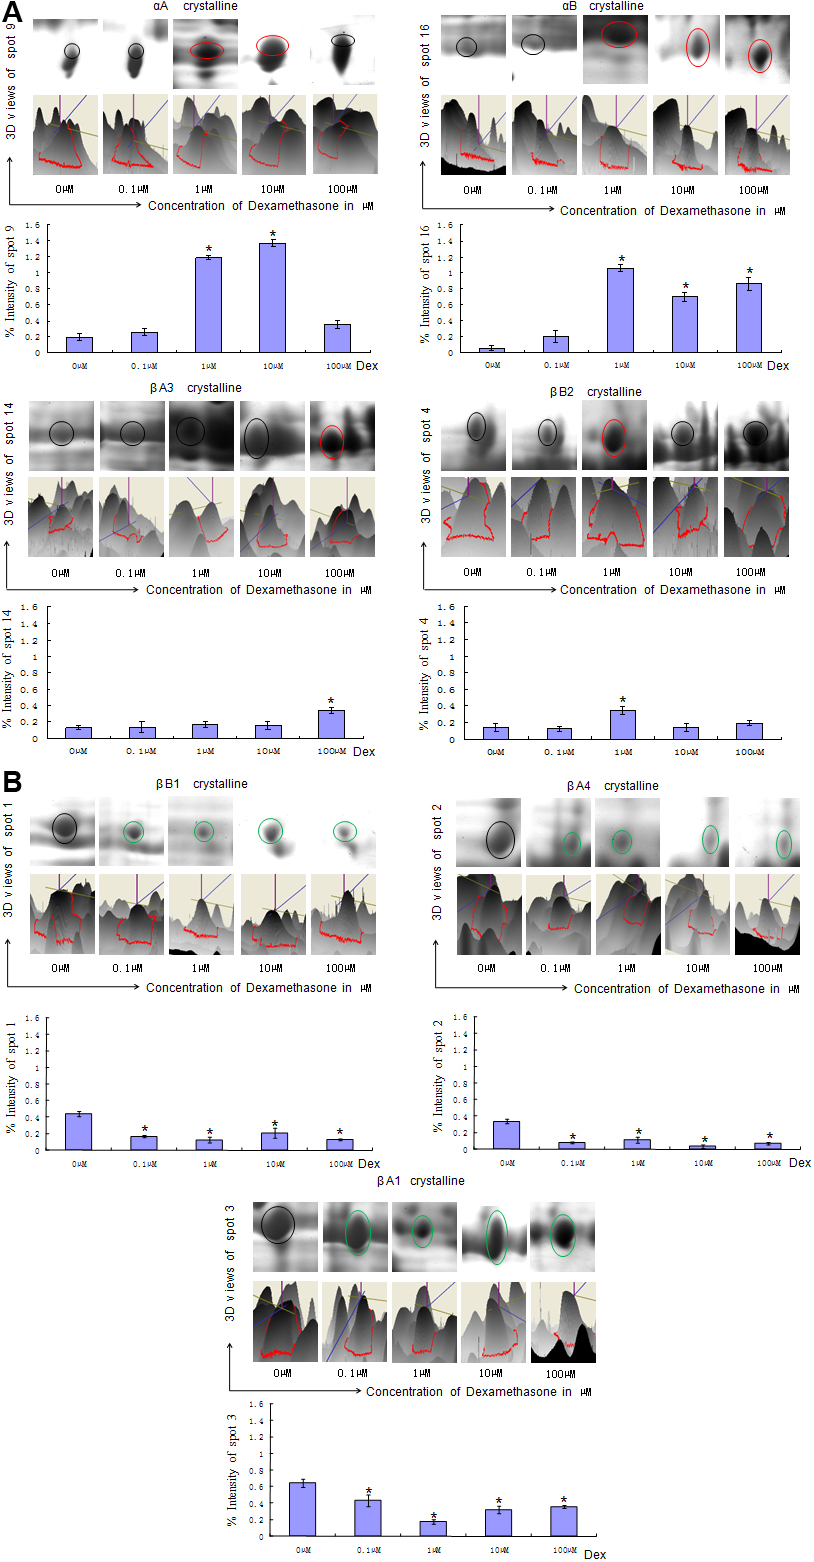
 Figure 3 of
Wang, Mol Vis 2011; 17:3423-3436.
Figure 3 of
Wang, Mol Vis 2011; 17:3423-3436.