Figure 2. 2DE gel image of the total proteome in the normal rat lenses and lenses exposed to 0, 0.1, 1, 10, and 100 µM Dex. The proteins
were separated by IEF and SDS–PAGE and stained with Coomassie brilliant blue. These spots were excised and analyzed by MALDI-TOF-MS/MS
mass spectrometry. Protein spots that were successfully identified were marked with numbers in this preparative gel image.
Increased intensity of protein spots were marked with red words and decreased intensity was marked with blue words, in which
significant changes were marked with a red * or with a blue *. Intensity of protein spots that did not increase or decrease
were marked with black words. Newly appeared protein spots were marked with a §.
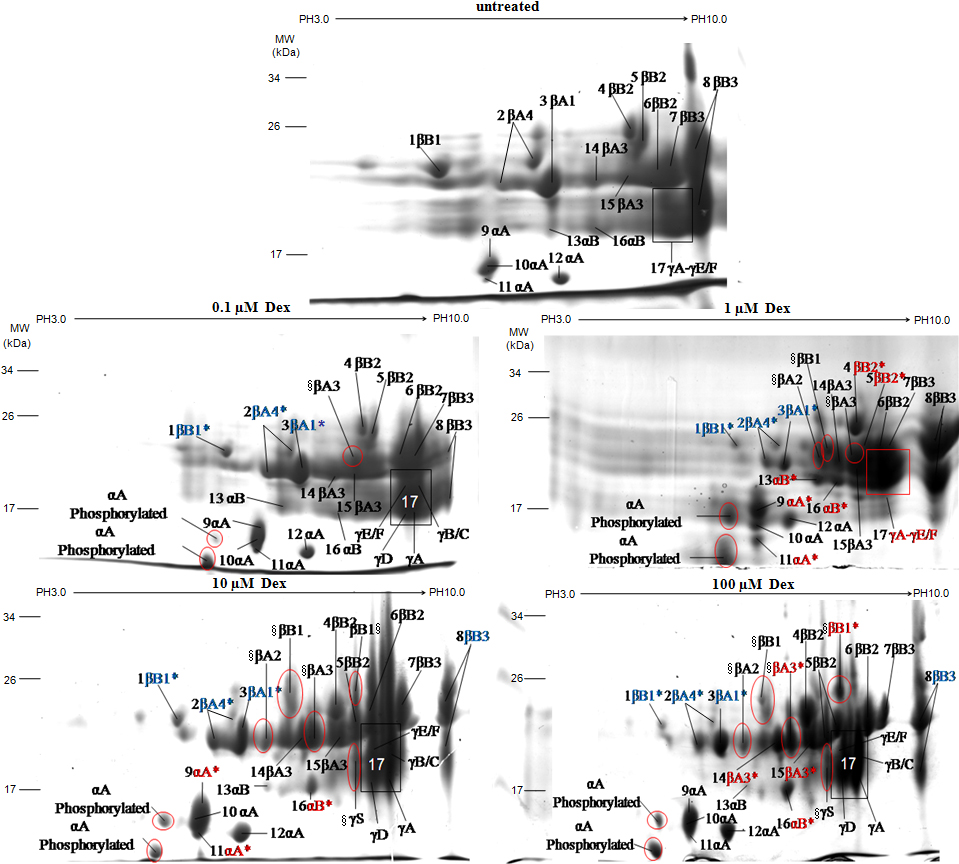
 Figure 2 of
Wang, Mol Vis 2011; 17:3423-3436.
Figure 2 of
Wang, Mol Vis 2011; 17:3423-3436.