Figure 8. The result of densitometry values of MMP 2 and 9. The effect of rapamycin on the expression of matrix metalloprotein (MMP)-2
and −9 was determined by Gelatin zymography. Three independent experiments were conducted. Bars represent standard deviation
(SD), and the data were shown as mean±SD. The asterisk (*) indicates p<0.05 in comparison between each rapamycin group and
the scratch group with independent samples t-test. a, scratch group; b1, 10 ng/ml rapamycin group; b2, 100 ng/ml rapamycin group; b3, 1000 ng/ml rapamycin group; c, no-scratch group.
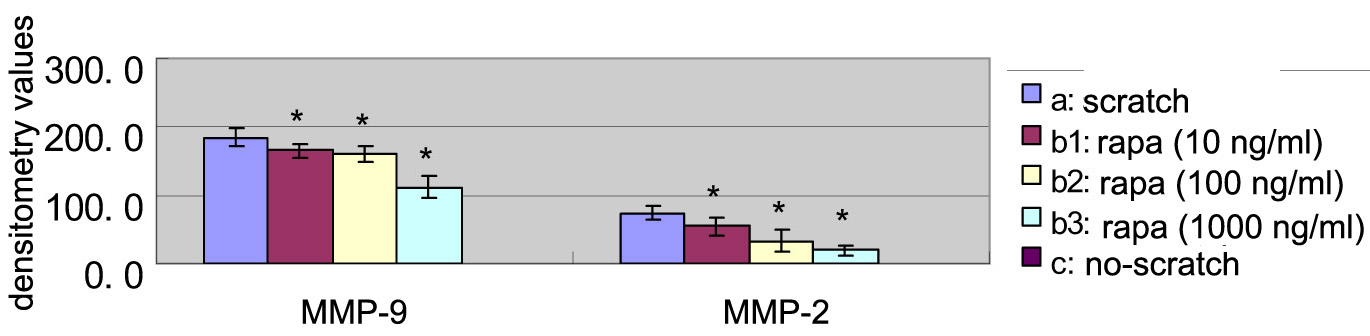
 Figure 8 of
Gao, Mol Vis 2011; 17:3406-3414.
Figure 8 of
Gao, Mol Vis 2011; 17:3406-3414.