Figure 6. Relative expression ratio
of the target gene versus the housekeeping gene (glyceraldehyde
3-phosphate dehydrogenase). The ratio for the vertical axis is
relative expression ratio of the target gene versus the
house-keeping gene (glyceraldehyde 3-phosphate dehydrogenase [GAPDH]).
Three independent experiments were conducted. Bars represent
standard deviation (SD), and the data were shown as mean±SD. The
asterisk indicates p<0.05 in comparison between each
rapamycin group and the scratch group with independent samples t-test.
Pound sign (#) indicates p<0.05 in comparison between the
scratch group and the no-scratch group with independent samples
t-test. a, scratch group; b1, 10 ng/ml
rapamycin group; b2, 100 ng/ml rapamycin group; b3,
1,000 ng/ml rapamycin group; c, no-scratch group.
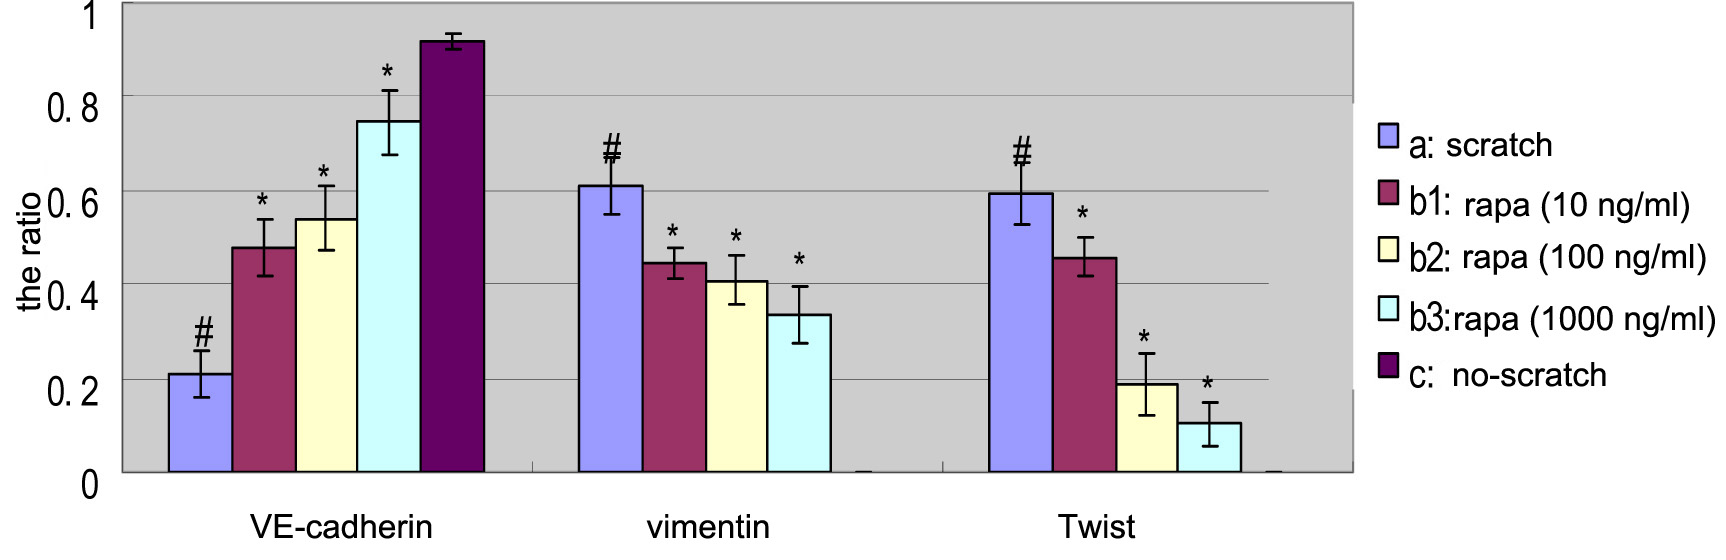
 Figure 6
of Gao, Mol Vis 2011; 17:3406-3414.
Figure 6
of Gao, Mol Vis 2011; 17:3406-3414.