Figure 4. The effect of rapamycin on the migration of EA.hy926 cells. EA.hy926 cells were treated with 0 to 1,000 ng/ml rapamycin for
8 h. Cell migration ability was determined by the scratch wound assay method. 0 ng/ml of rapamycin represents the control
group. Bars represent SD (n=6 photographs per measurement). Similar results were obtained in three independent experiments,
and the data were shown as mean±SD. The asterisk indicates p<0.05, compared with the control group with independent samples
t-test.
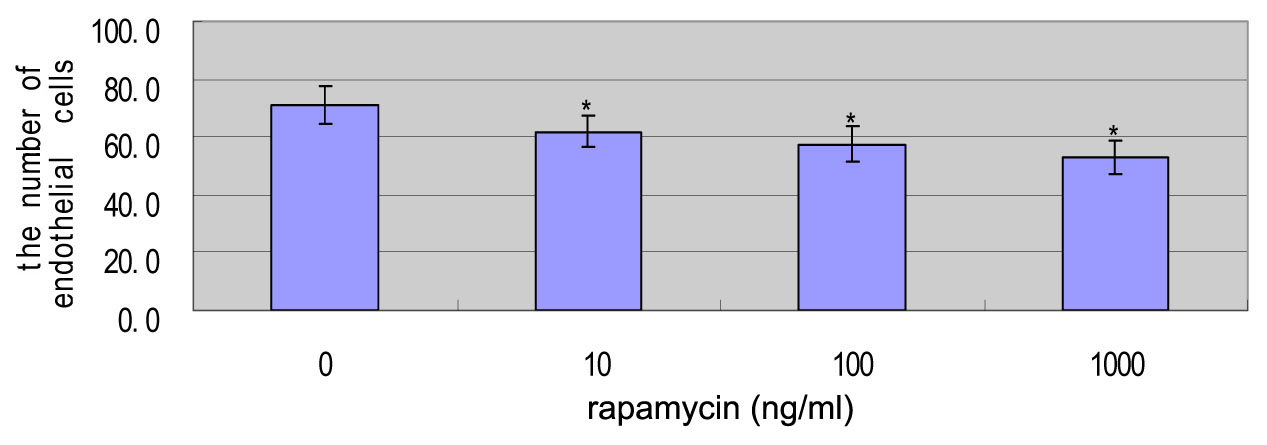
 Figure 4 of
Gao, Mol Vis 2011; 17:3406-3414.
Figure 4 of
Gao, Mol Vis 2011; 17:3406-3414.