Figure 1. Real time PCR shows the relative expression of TLR2 and TLR4 mRNA in high glucose and high mannitol treated HCEC compared with untreated HCEC. The untreated HCEC is regarded as standard
control (RQ=1), treated cells are expressed as the multiple of the untreated HCEC. Bars represent means±SEM of 3 independent
experiments. *represent a p<0.05 versus control. RQ represent relative quantity.
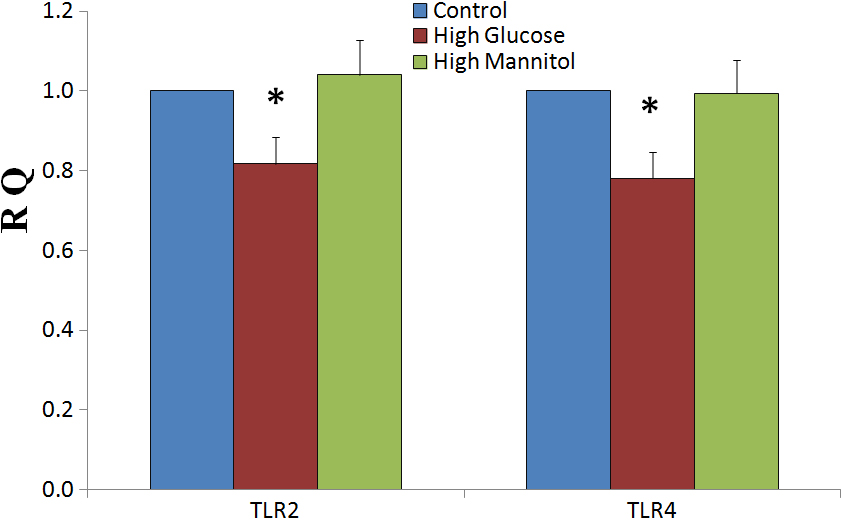
 Figure 1 of
Ni, Mol Vis 2011; 17:3384-3391.
Figure 1 of
Ni, Mol Vis 2011; 17:3384-3391.