Figure 2. The results of γH2AX foci formation in HCEs after BAC with or without HA treatment. A: The percentage of γH2AX foci-positive cells. After 30 min incubation, four concentrations of BAC-treated cells showed a
significant increase DSBs compared to the control group, whereas a combination of 0.2% HA and BAC resulted in a significantly
smaller number of DSBs. The cells treated with a combination of 0.2% HA and 0.001% BAC showed a significant increase in the
percentage of γH2AX foci-positive cells compared to the control cells. B: Representative images of γH2AX foci. The nuclei stained by DAPI exhibit in blue, while the γH2AX foci stained by FITC exhibit
in green. Differences were significant at p<0.01 (two asterisks) and p<0.001 (three asterisks) compared to control cells,
and p<0.01 (two hash marks) and p<0.001 (three hash marks) compared between cells treated with BAC alone (BAC/HA-) and cells treated with a combination of 0.2% HA and BAC (BAC/HA+).
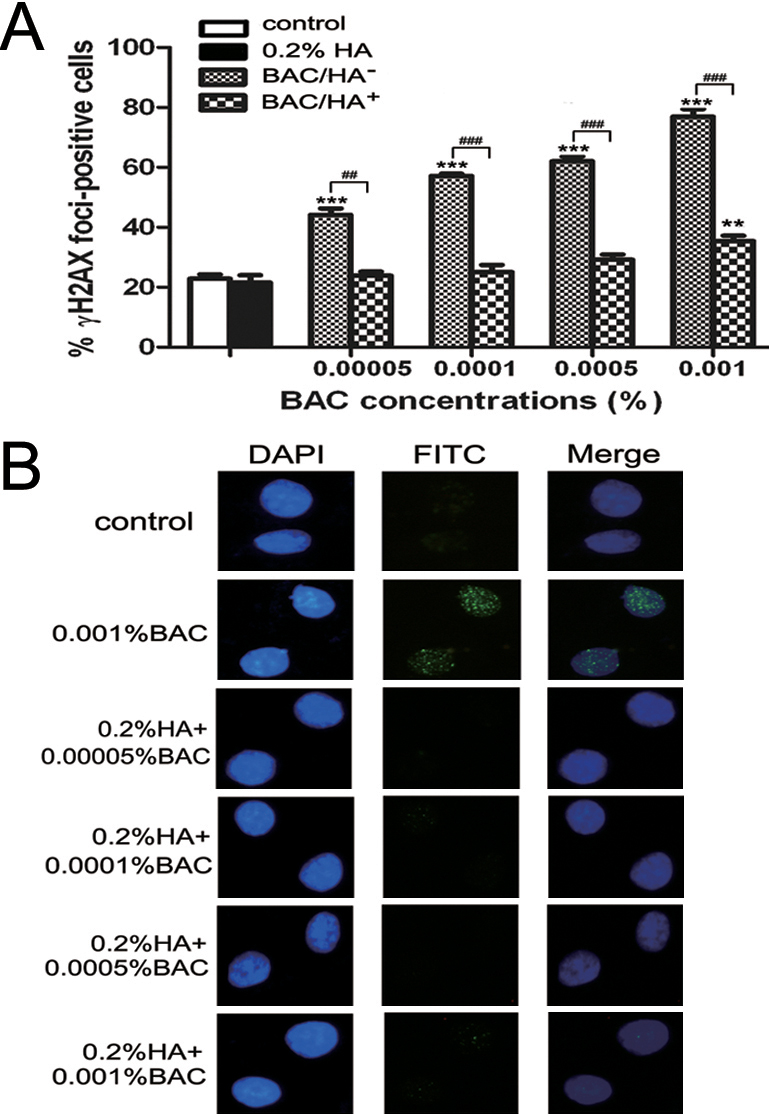
 Figure 2 of
Wu, Mol Vis 2011; 17:3364-3370.
Figure 2 of
Wu, Mol Vis 2011; 17:3364-3370.