Figure 4. Effect of different concentrations of Bevacizumab on BCE cell death as quantified by flow cytometry. Flow cytometry analysis
of BCE cells treated with Bevacizumab and/or VEGF. Cells were stained with annexin V/propidium iodide (PI) before flow cytometry
analysis. Percentages of annexin V/PI negative (viable cells) are displayed in the lower left quadrant; annexin V negative/PI
positive cells are displayed in the upper left quadrant. Percentages of annexin V positive/PI positive (necrotic) cells are
displayed in the upper right quadrant. Percentages of annexin V positive/ PI negative (early apoptotic) are displayed in the
lower right quadrant. Cells under serum-starved conditions were considered as positive controls. BEV (Bevacizumab); V (vascular
endothelial growth factor; VEGF).
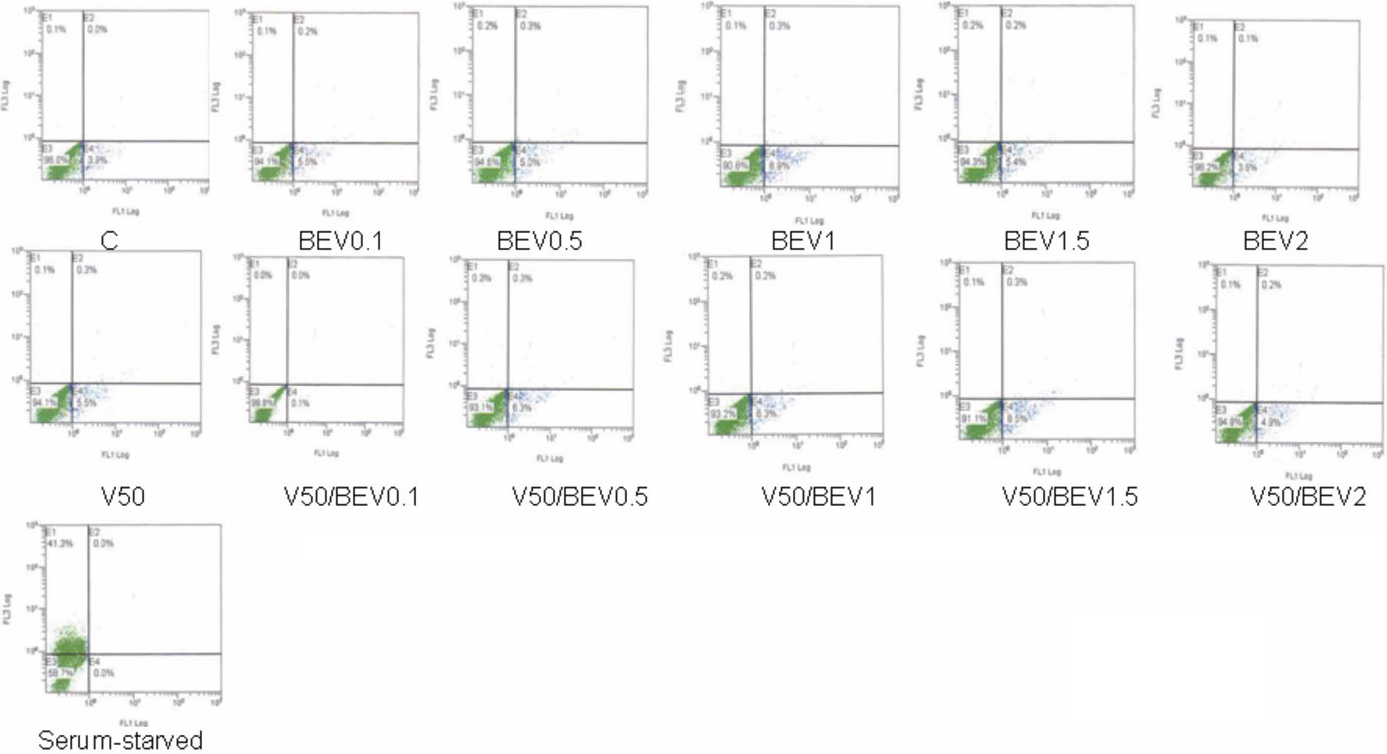
 Figure 4 of
Rusovici, Mol Vis 2011; 17:3339-3346.
Figure 4 of
Rusovici, Mol Vis 2011; 17:3339-3346.