Figure 2. Effect of Bevacizumab and VEGF on BCE cell morphology. A: Effect of different concentrations of Bevacizumab alone on BCE cell morphology. B: Effect of different concentrations of Bevacizumab and VEGF on BCE cell morphology. Photomicrographs showing no observable
differences in morphology among different treatment groups and controls. Bright-field images were taken at a 20× magnification.
C: Serum-starved BCE cells showing small, picknotic nuclei, shrunken cytosol served as positive controls. BEV (Bevacizumab);
V (vascular endothelial growth factor; VEGF).
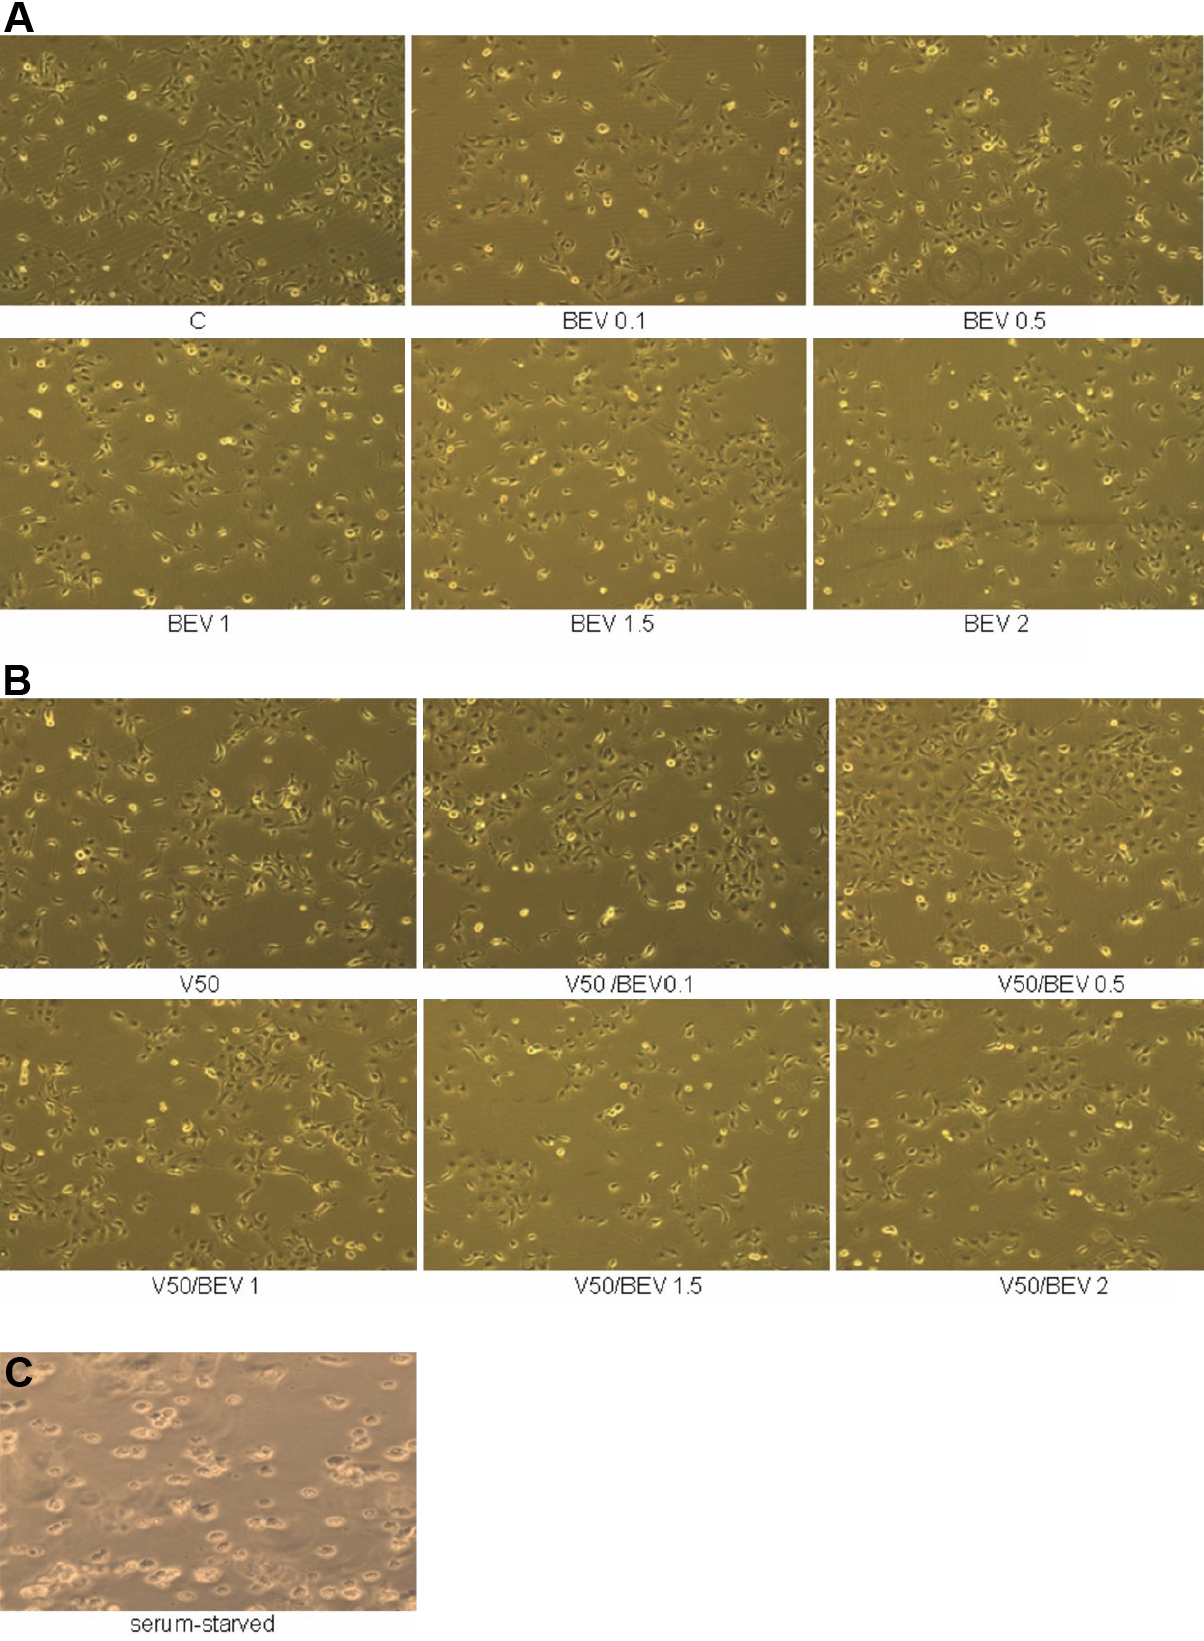
 Figure 2 of
Rusovici, Mol Vis 2011; 17:3339-3346.
Figure 2 of
Rusovici, Mol Vis 2011; 17:3339-3346.