Figure 5 of
Li, Mol Vis 2011; 17:3314-3325.
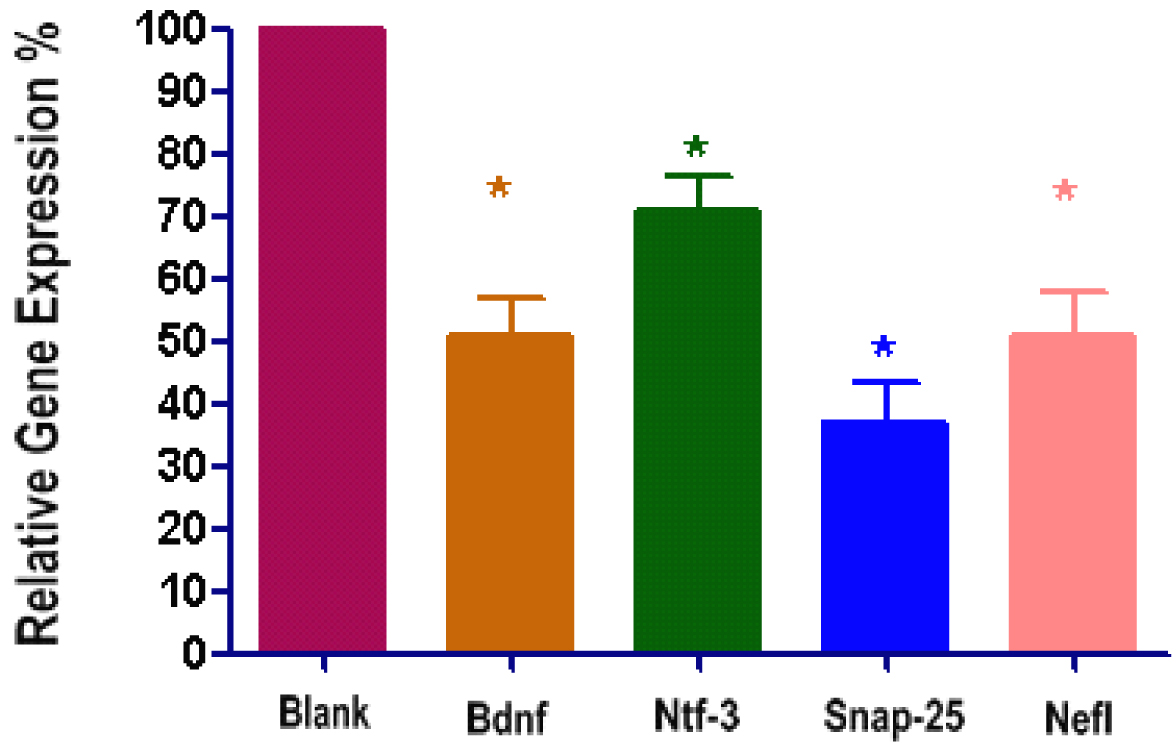
Figure 5.
Validation of microarray data in stable transfected PC12 cells with quantitative real-time PCR. Bdnf was 57.52% of the expression in the Blank cells, Ntf3 was 62.42%, Snap25 was 36.40%, and Nefl was 55.66% (*p<0.05 versus control, n=3).
 Figure 5
of Li, Mol Vis 2011; 17:3314-3325.
Figure 5
of Li, Mol Vis 2011; 17:3314-3325.