Figure 4. The expression changes of
ASIC 1a in RGCs were detected using western blot following
hypoxic treatment. Equal protein loading was assured by the use
of a GAPDH-specific antibody on the same blot. A:
Immunoreactive bands for ASIC 1a and GAPDH in control and
hypoxic groups. B: Densitometry of the immunoreactive
bands for ASIC 1a . Data are expressed as a percentage of the
control value. Each column represents mean±SEM (n=3). Hypoxia
significantly elevated the expression of ASIC 1a in the cultured
RGCs. Asterisk indicates p<0.05, compared with the ratio of
control group.
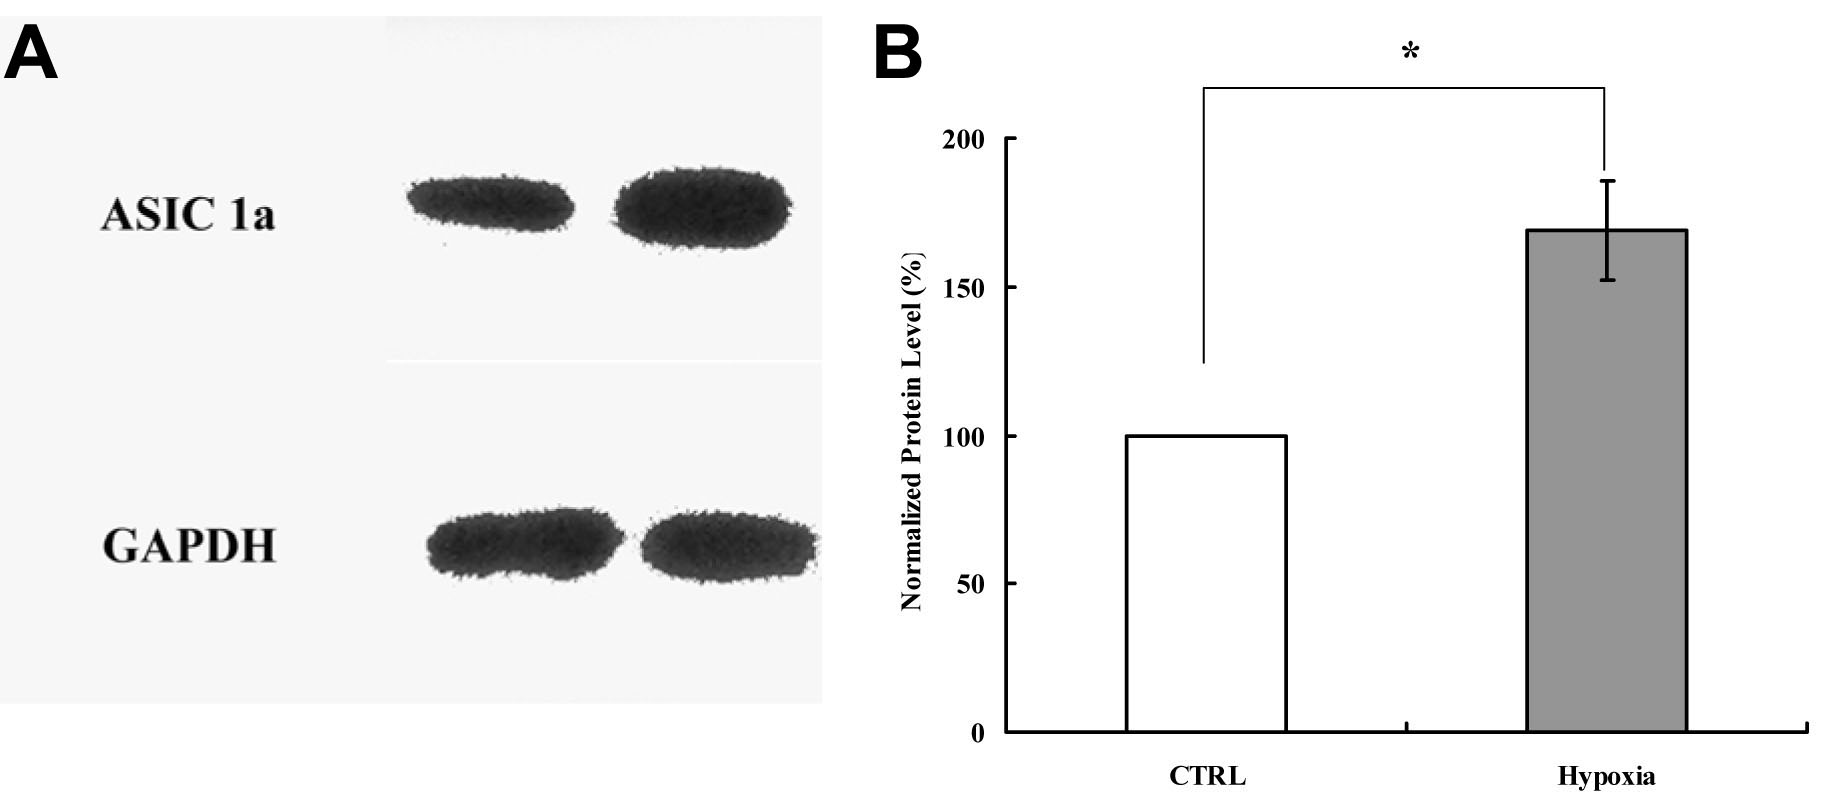
 Figure 4
of Tan, Mol Vis 2011; 17:3300-3308.
Figure 4
of Tan, Mol Vis 2011; 17:3300-3308.