Figure 3. A: Representative
images showing enhancement of the acid-induced [Ca2+]i
elevation in cultured retinal ganglion cells (RGCs). B:
Summary of results on the ASIC-mediated [Ca2+]i
elevation. Dashed line indicates the basal level of fluorescence
ratio (340/380). Inset, representative ratiometric measurements
of [Ca2+]i elevation induced by a solution of pH 6.0.
Data are mean±SEM (n=12 for each group). Asterisk indicates
p<0.05, compared with the ratio induced by pH 7.4.
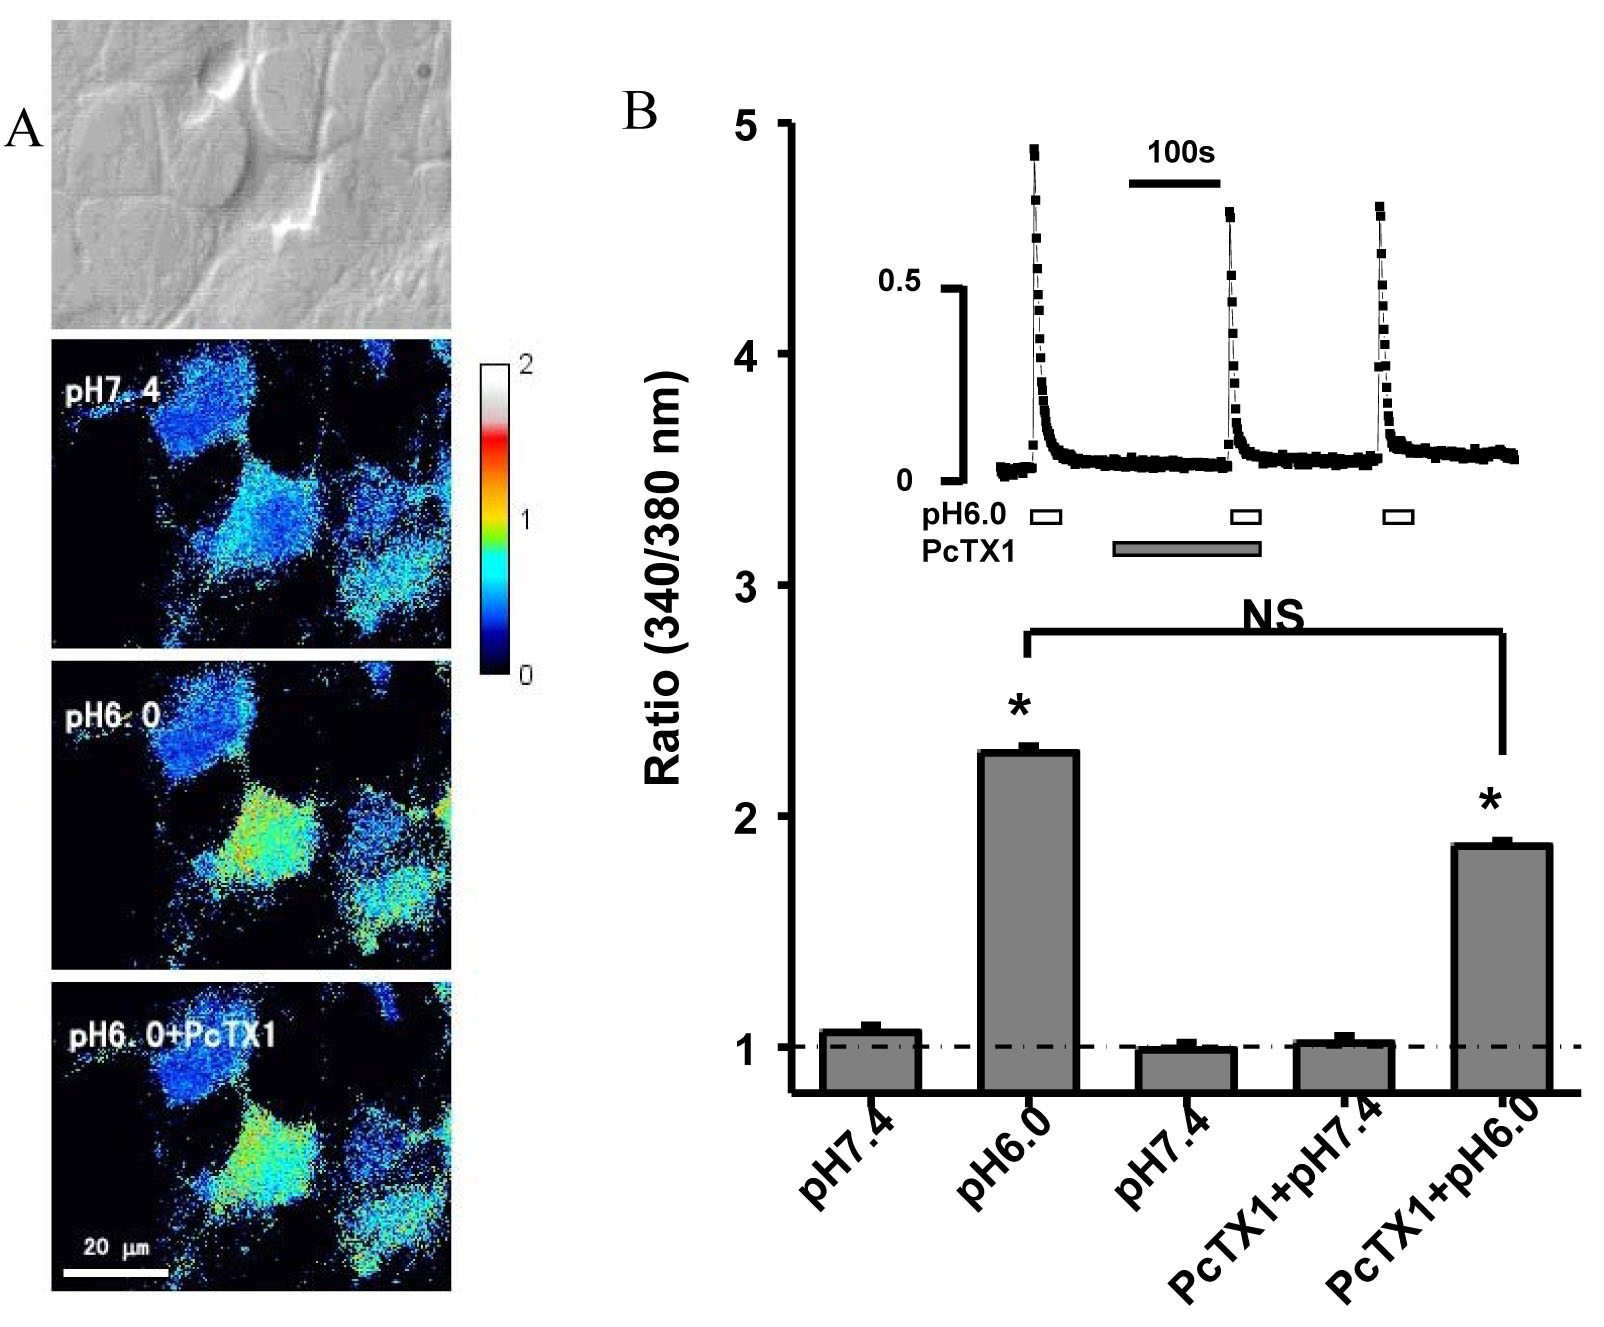
 Figure 3
of Tan, Mol Vis 2011; 17:3300-3308.
Figure 3
of Tan, Mol Vis 2011; 17:3300-3308.