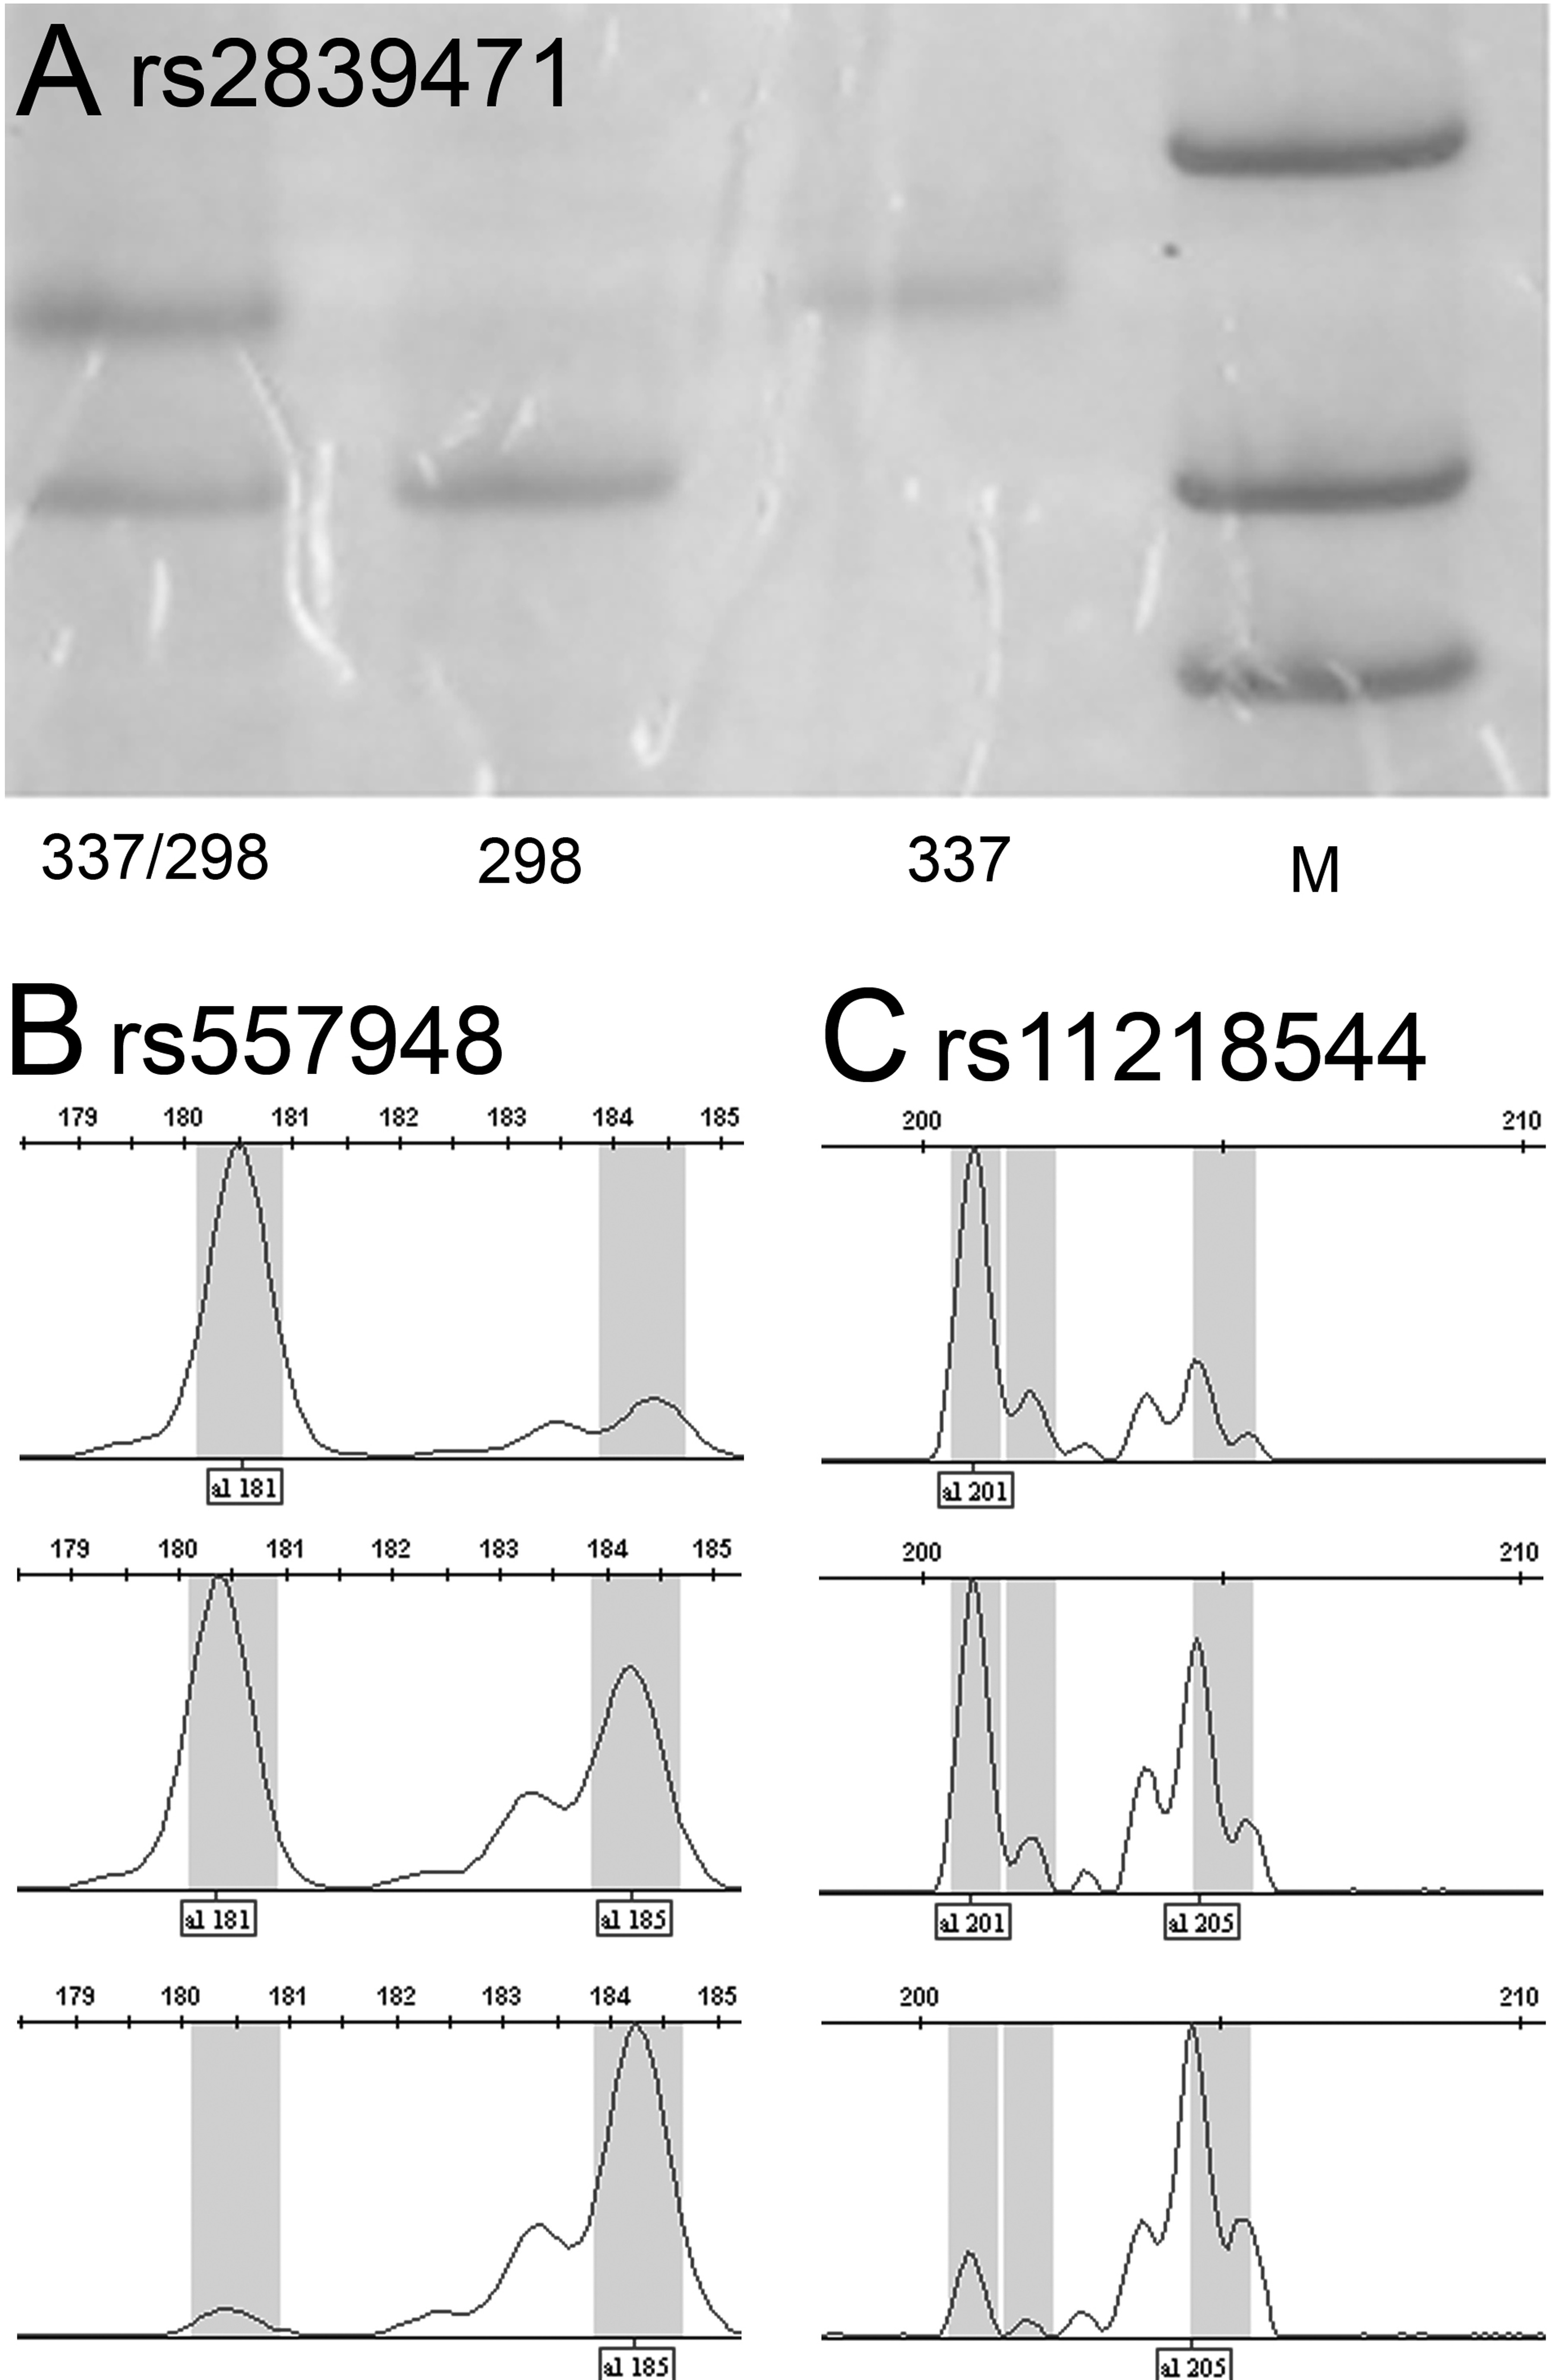
Figure 1. Genotyping of
rs2839471,
rs577948,
and
rs11218544.
The three SNPs were successfully genotyped in 2,870 subjects. M:
100 bp DNA ladder.
A: RFLP analysis of SNP
rs2839471.
The double bands at 337 bp and 298 bp represent genotype C/T,
the single band at 298 bp represents C/C, and the single band at
337 bp represents T/T. Capillary electrophoresis analysis was
used for genotyping
rs577948
and
rs11218544.
The three peak patterns represent three different SNP genotypes.
B: SNP
rs577948:
the single peak at 181 bp is genotype A/A, the double peaks at
181 bp and 185 bp are A/G, and the single peak at 185 bp is G/G.
C: SNP rs11218544: the single peak at 201 bp is T/T, the
double peaks at 201 bp and 205 bp are T/G, and the single peak
at 205 bp is G/G.
 Figure 1
of Wang, Mol Vis 2011; 17:3290-3299.
Figure 1
of Wang, Mol Vis 2011; 17:3290-3299.