Figure 4. Scotopic 15 Hz flicker
electroretinogram characteristics in the proband (A),
case II 1 (B), and a control subject (C) are
presented. Various intensities between −3.4 log scot td-sec and
+0.35 log scot td-sec were performed. Dashed lines show the
response filtered using a simple Fourier domain, bandpass filter
(13–18 Hz). In the control panel (C), the rod system
activity observed between −3.40 log scot td-sec and −2.0 log
scot td-sec intensities originates from the slow rod pathway. At
an intensity of −1.52 log scot td-sec, there is no discernable
rod activity denoting neutralization of activity between the
slow and fast rod pathways (C). At intensities of −1.30
log scot td-sec, the rod system activity reappears (which is out
of phase to the response seen at −2.0 log scot td-sec and
originates in the fast rod pathways), which progressively
increases in amplitude and shows progressive advancement in
phase (C). In case IV 1 and case II 1, the rod activity
is discernable only at intensities higher than +0.19 log scot
td-sec and −0.62 log scot td-sec, respectively (figures A
and B, respectively). This suggests that only residual
fast rod pathway activity is seen in CACNA1F-related
disease.
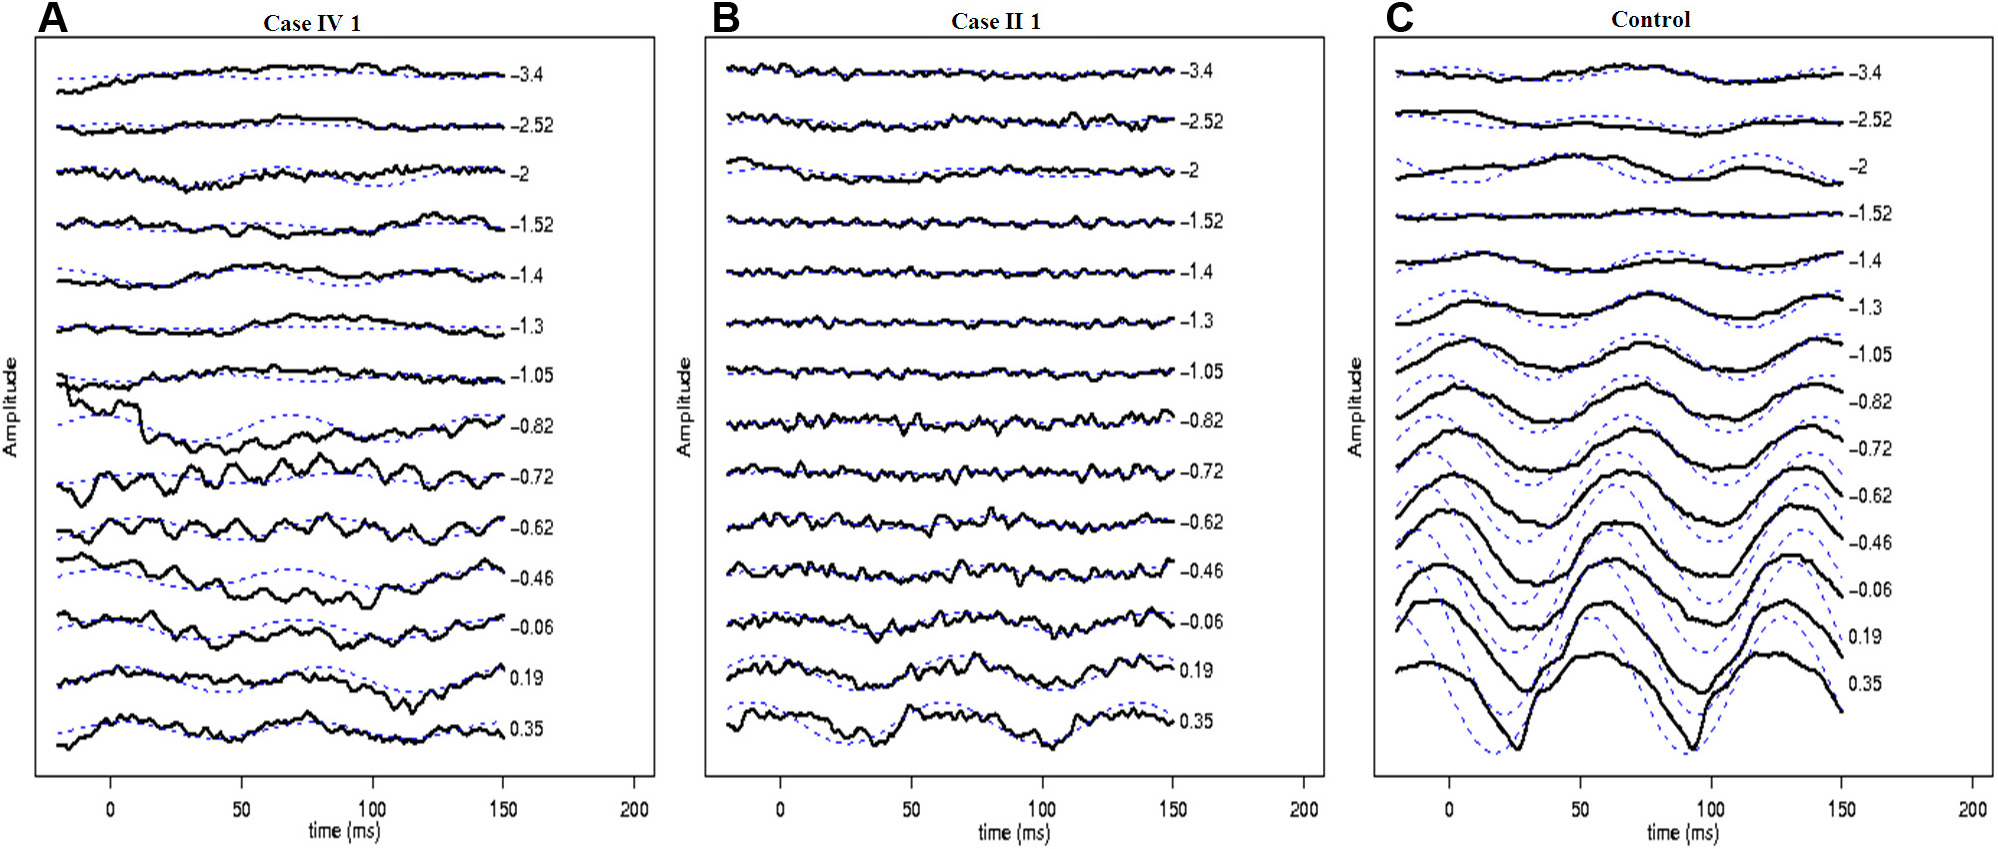
 Figure 4
of Vincent, Mol Vis 2011; 17:3262-3270.
Figure 4
of Vincent, Mol Vis 2011; 17:3262-3270.