Figure 3. Full-field
electroretinogram (ERG) characteristics in case IV 1 (A),
case II 1 (B), and a control subject (C) are
presented. Dim light scotopic response (dark adapted [DA] ERG to
0.01 cd-seconds per square meter–DA 0.01 ERG) showed severe
b-wave reduction in case IV 1 (3A) and was at the lower limit of
normal in case II 1 (B). Both cases showed
electronegative configuration to combined rod-cone response (DA
ERG to 2.29 cd-seconds per square meter – DA 2.29 ERG; A
and B), and case IV 1 showed additional a-wave
involvement. Single flash photopic response (light adapted (LA)
ERG to 2.29 cd-seconds per square meter–LA 2.29 ERG) showed
severe reduction and delay of the a- and b-waves with reduced
b/a ratio in both subjects (A and B). The 30 Hz
flicker response (LA 30 Hz flicker) showed severely reduced and
delayed b-waves in both cases (A and B). Please
note that the scale on the y-axis is different for the cases and
the control.
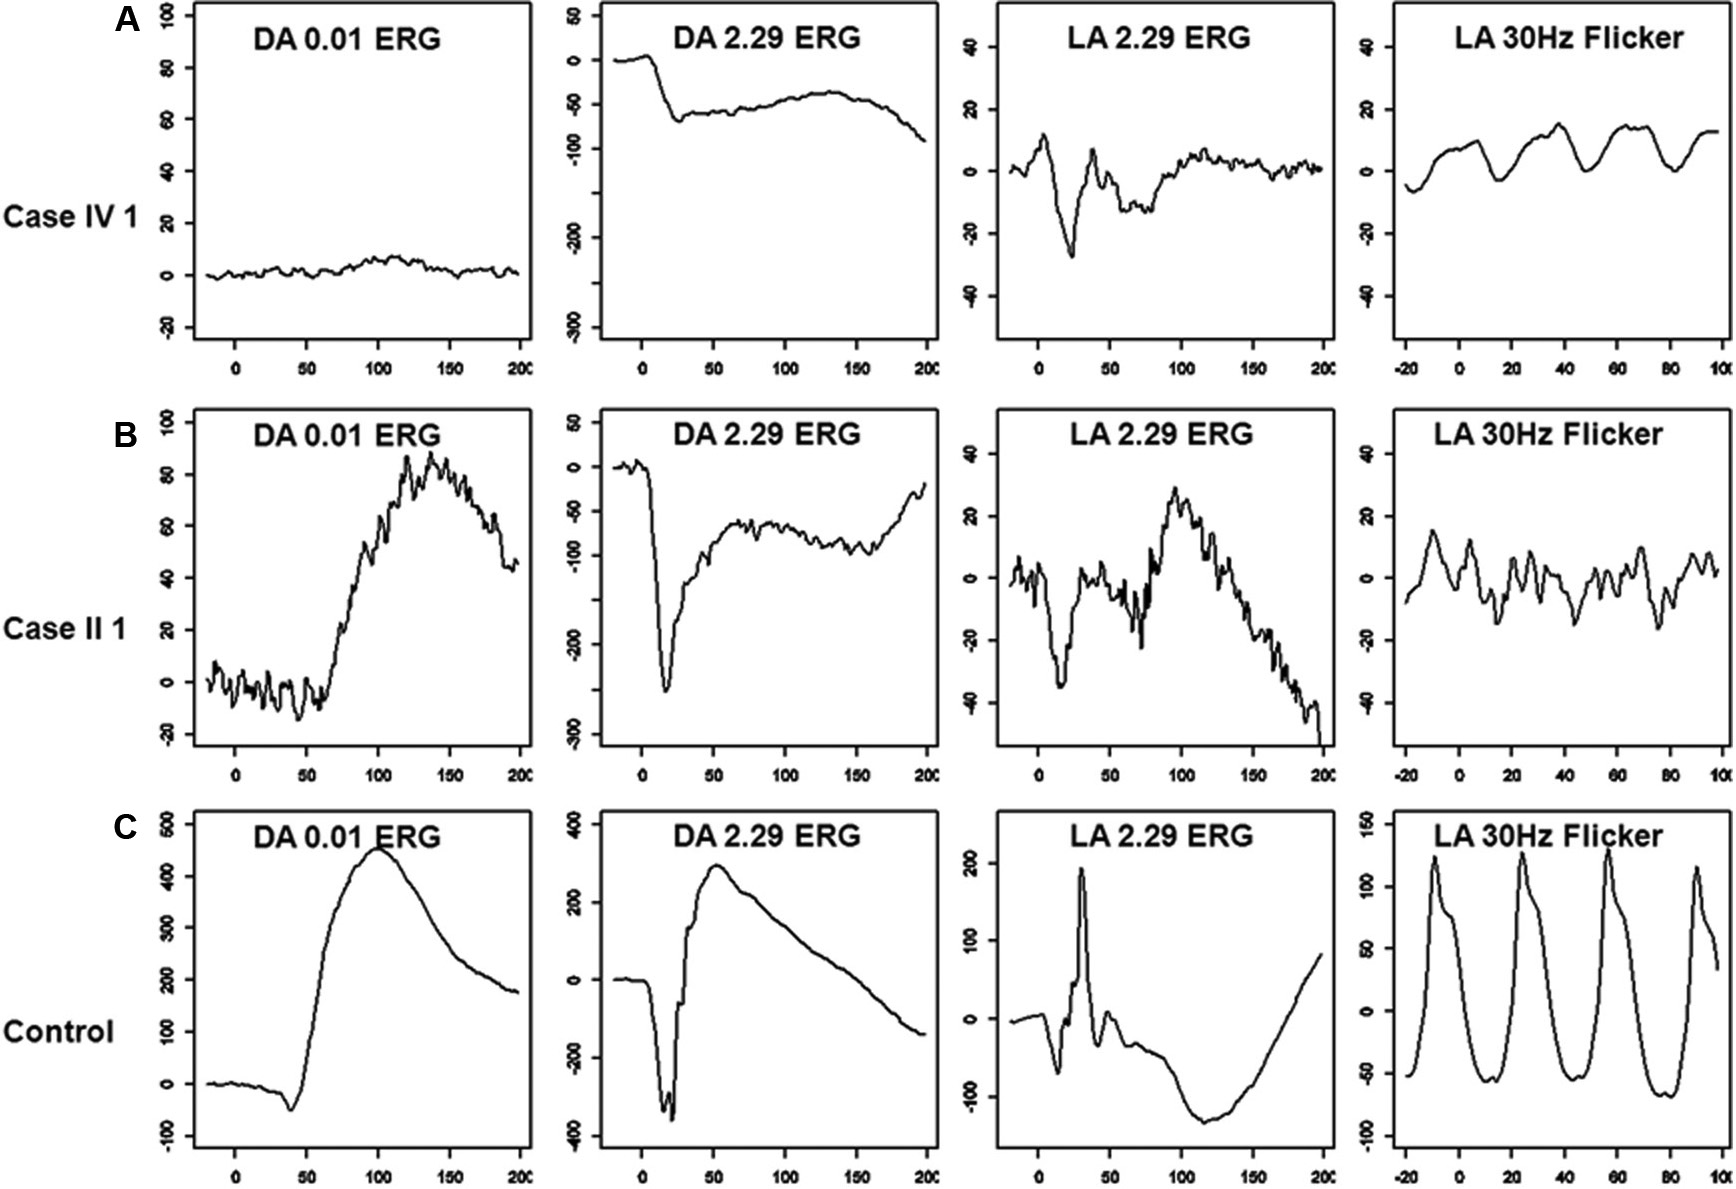
 Figure 3
of Vincent, Mol Vis 2011; 17:3262-3270.
Figure 3
of Vincent, Mol Vis 2011; 17:3262-3270.