Figure 7 of
Augusteyn, Mol Vis 2011; 17:3234-3242.
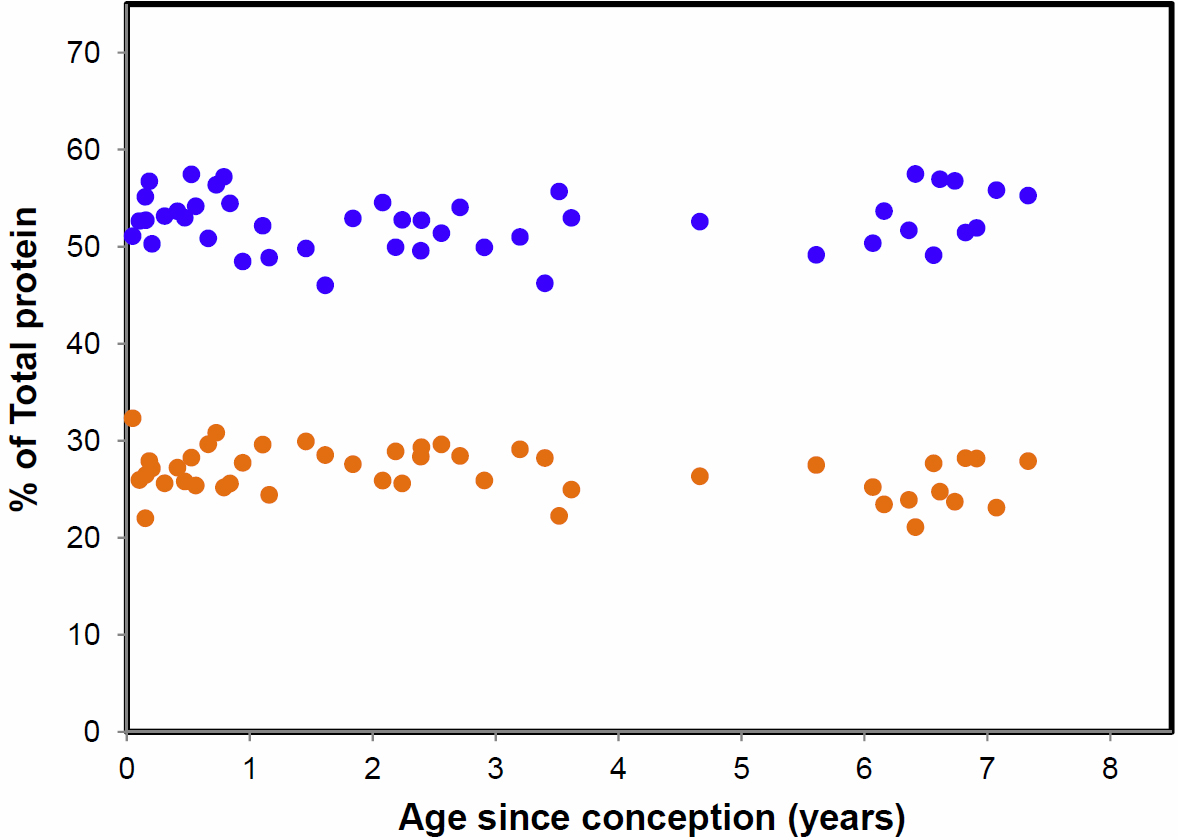
Figure 7.
The proportions of soluble plus insoluble α- (
•••
) and β-(
•••
) crystallins as a function of age since conception.
 Figure 7
of Augusteyn, Mol Vis 2011; 17:3234-3242. Figure 7
of Augusteyn, Mol Vis 2011; 17:3234-3242.
Figure 7
of Augusteyn, Mol Vis 2011; 17:3234-3242. Figure 7
of Augusteyn, Mol Vis 2011; 17:3234-3242.