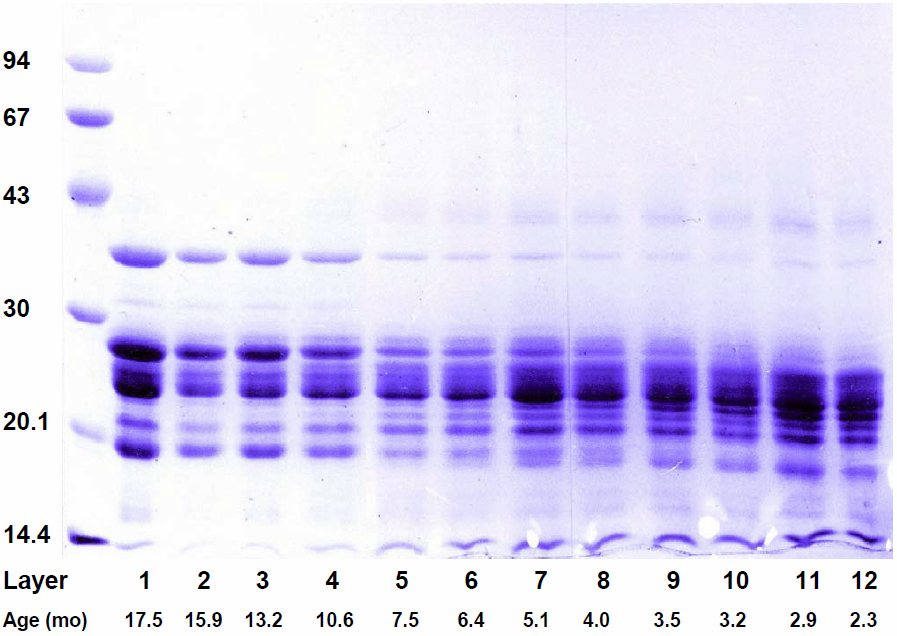
Figure 3. SDS–PAGE analysis of the
soluble proteins in concentric layers from a 20-month-old
eastern gray kangaroo. Sample numbers indicate the order in
which the layers were removed from the lens, with layer 1
corresponding to the outer cortex + epithelium and layer 12 the
most central region. The average age of each layer, in months,
is indicated. Standard protein sizes (kDa) are indicated on the
left.

 Figure 3
of Augusteyn, Mol Vis 2011; 17:3234-3242.
  Figure 3
of Augusteyn, Mol Vis 2011; 17:3234-3242.