Figure 5. Effects of mapracorat and
dexamethasone on interleukin-8 (IL-8) secretion induced by
ionomycin in eosinophils. Cells (0.5x10⁶ cells/well)
were suspended in cell culture medium containing 0.1% fetal
bovine serum and exposed to phosphate buffered saline (PBS) or
to the vehiche; alternatively, cells were treated with
mapracorat or dexamethasone (0.001–10 μM); after 45 min,
ionomycin (2 μM) was added. Controls were not exposed to
ionomycin. IL-8 was assayed by an enzyme-linked immunosorbent
assay on supernatant samples collected 18 h later, as described
under Methods. Data are presented as mean±standard error of the
mean from six experiments performed in triplicate using
different eosinophil cell cultures (for the sake of clarity some
error bars are not reported). Abbreviations: Ctrl, represents
controls; ion represents ionomycin; DEX represents
dexamethasone. Mapracorat did not cause any significant change
of the concentration-response curve in comparison to
dexamethasone (two-way ANOVA with Bonferroni post test).
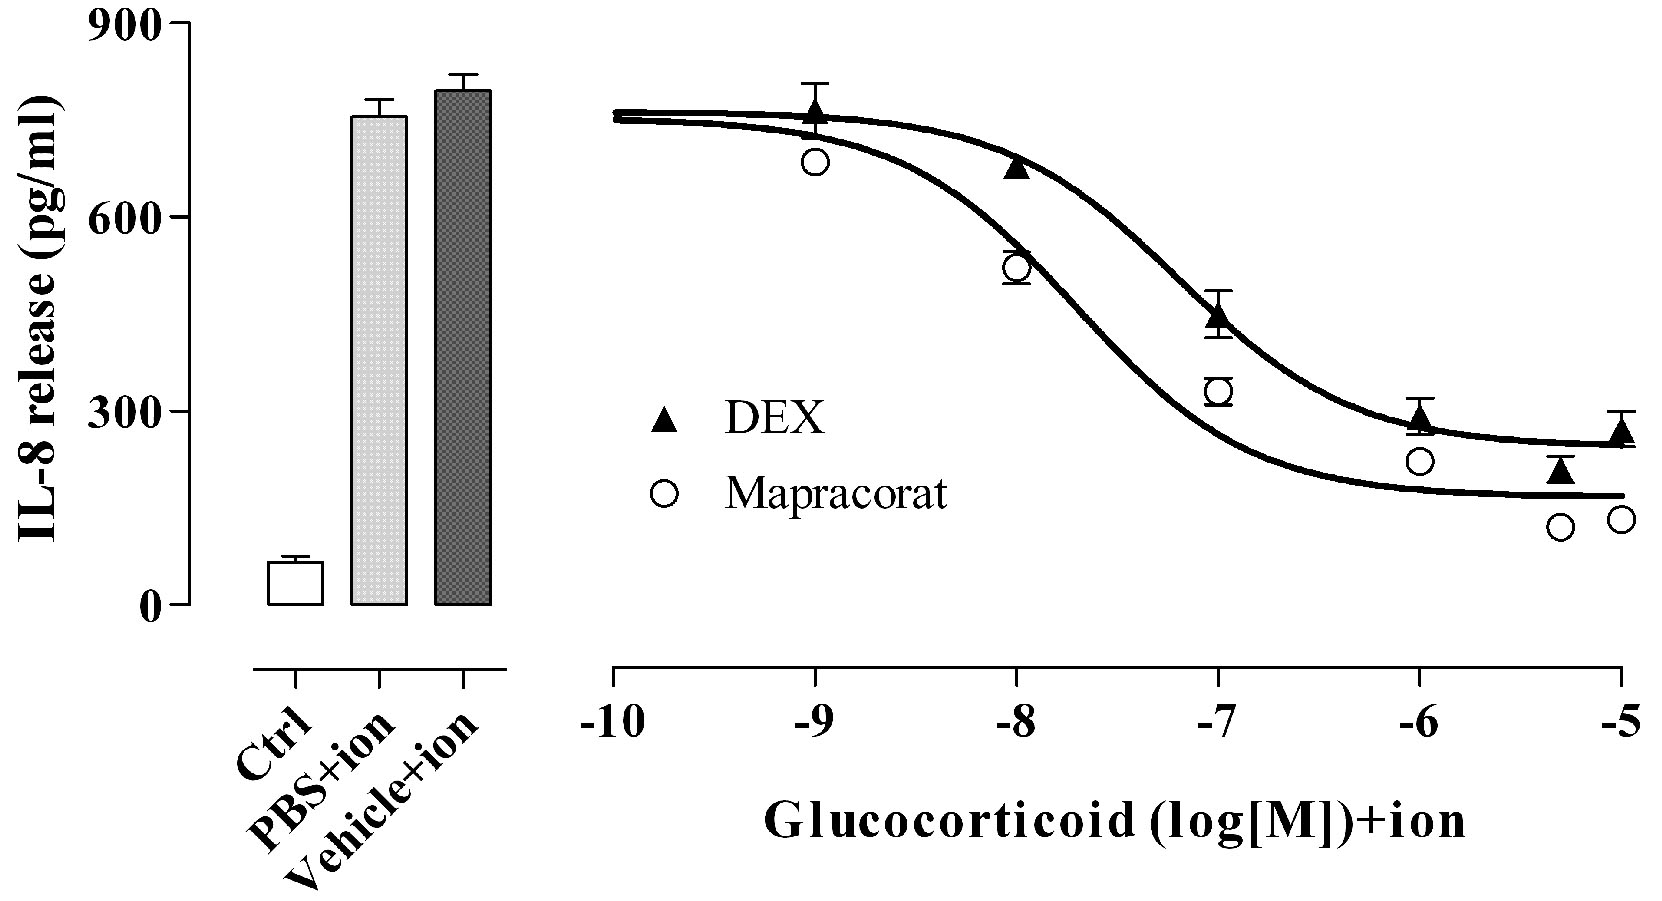
 Figure 5
of Baiula, Mol Vis 2011; 17:3208-3223.
Figure 5
of Baiula, Mol Vis 2011; 17:3208-3223.