Figure 5. Caveolin-1 and clathrin
immunofluorescence in HCE and IOBA-NHC cells after HA-CSO NP
incubation. Caveolin expression was higher than clathrin expression.
Merged images showed co-localization of HA-CSO NP with caveolin
(staining at arrowheads). Representative images of four different
experiments are shown.
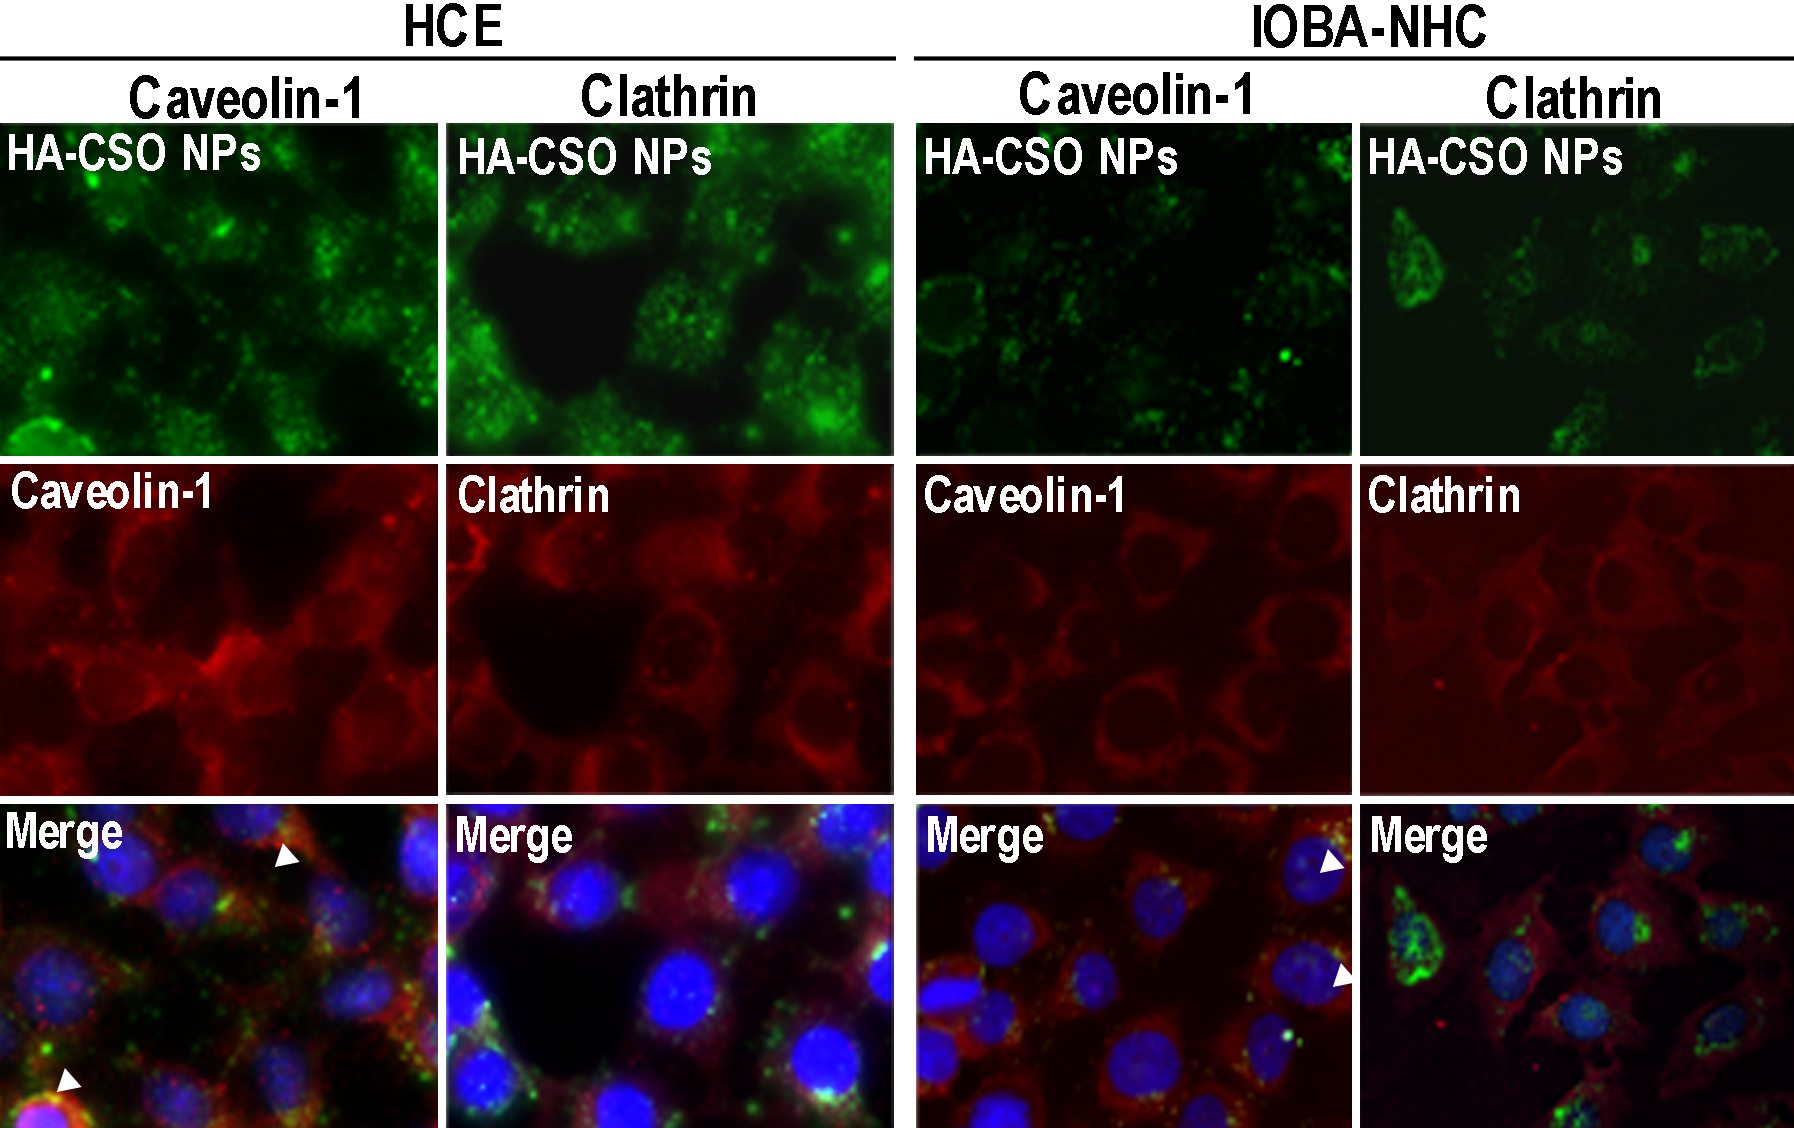
 Figure 5 of Contreras-Ruiz, Mol Vis 2011; 17:279-290.