Figure 1. Fluorescence micrographs of
HA-CSO NP uptake (6 h). Fluoresceinamine-HA (green) and Cy3-plasmid
(red) were evident in the cytoplasm of HCE and IOBA-NHC cells. Nuclei
were counterstained with Hoescht dye (blue). Insets show higher
magnification of cytoplasmic NPs. Representative images of four
different experiments are shown. (Magnification 63×, inset
magnification 252×).
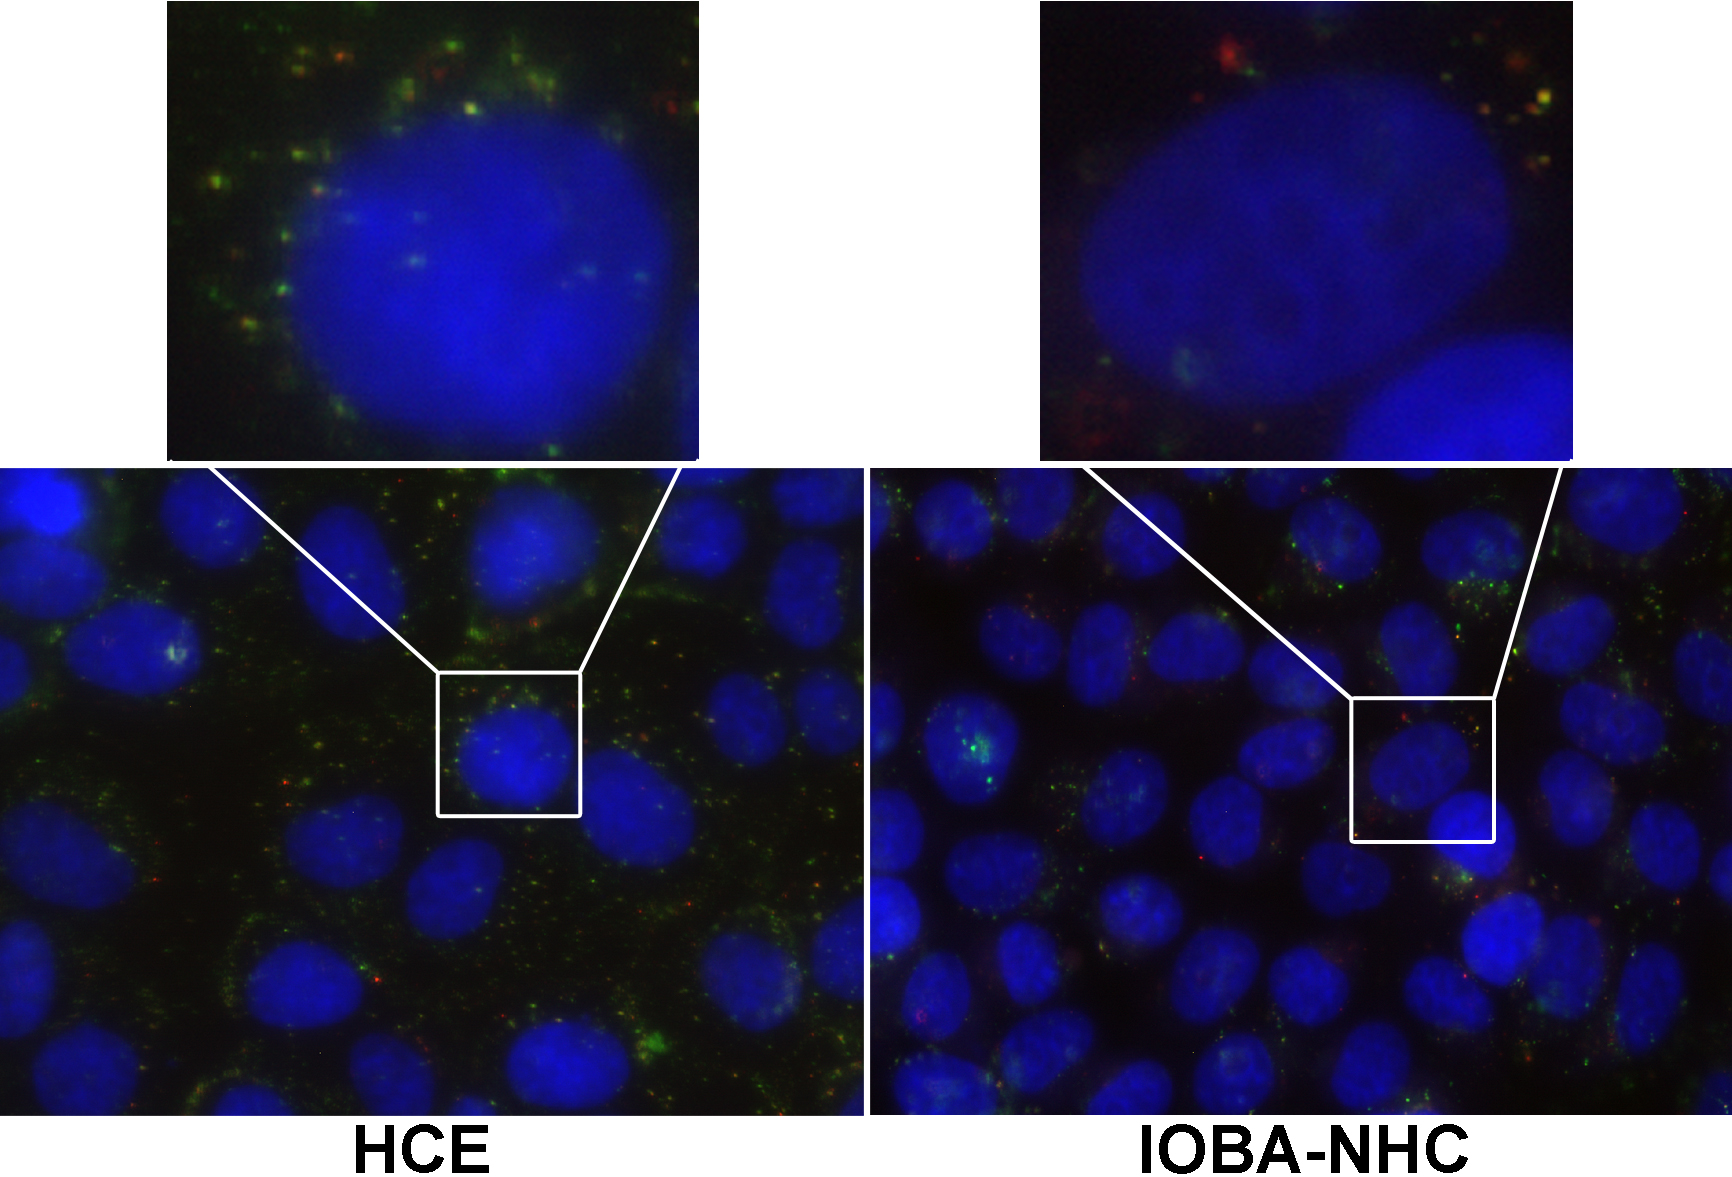
 Figure 1 of Contreras-Ruiz, Mol Vis 2011; 17:279-290.