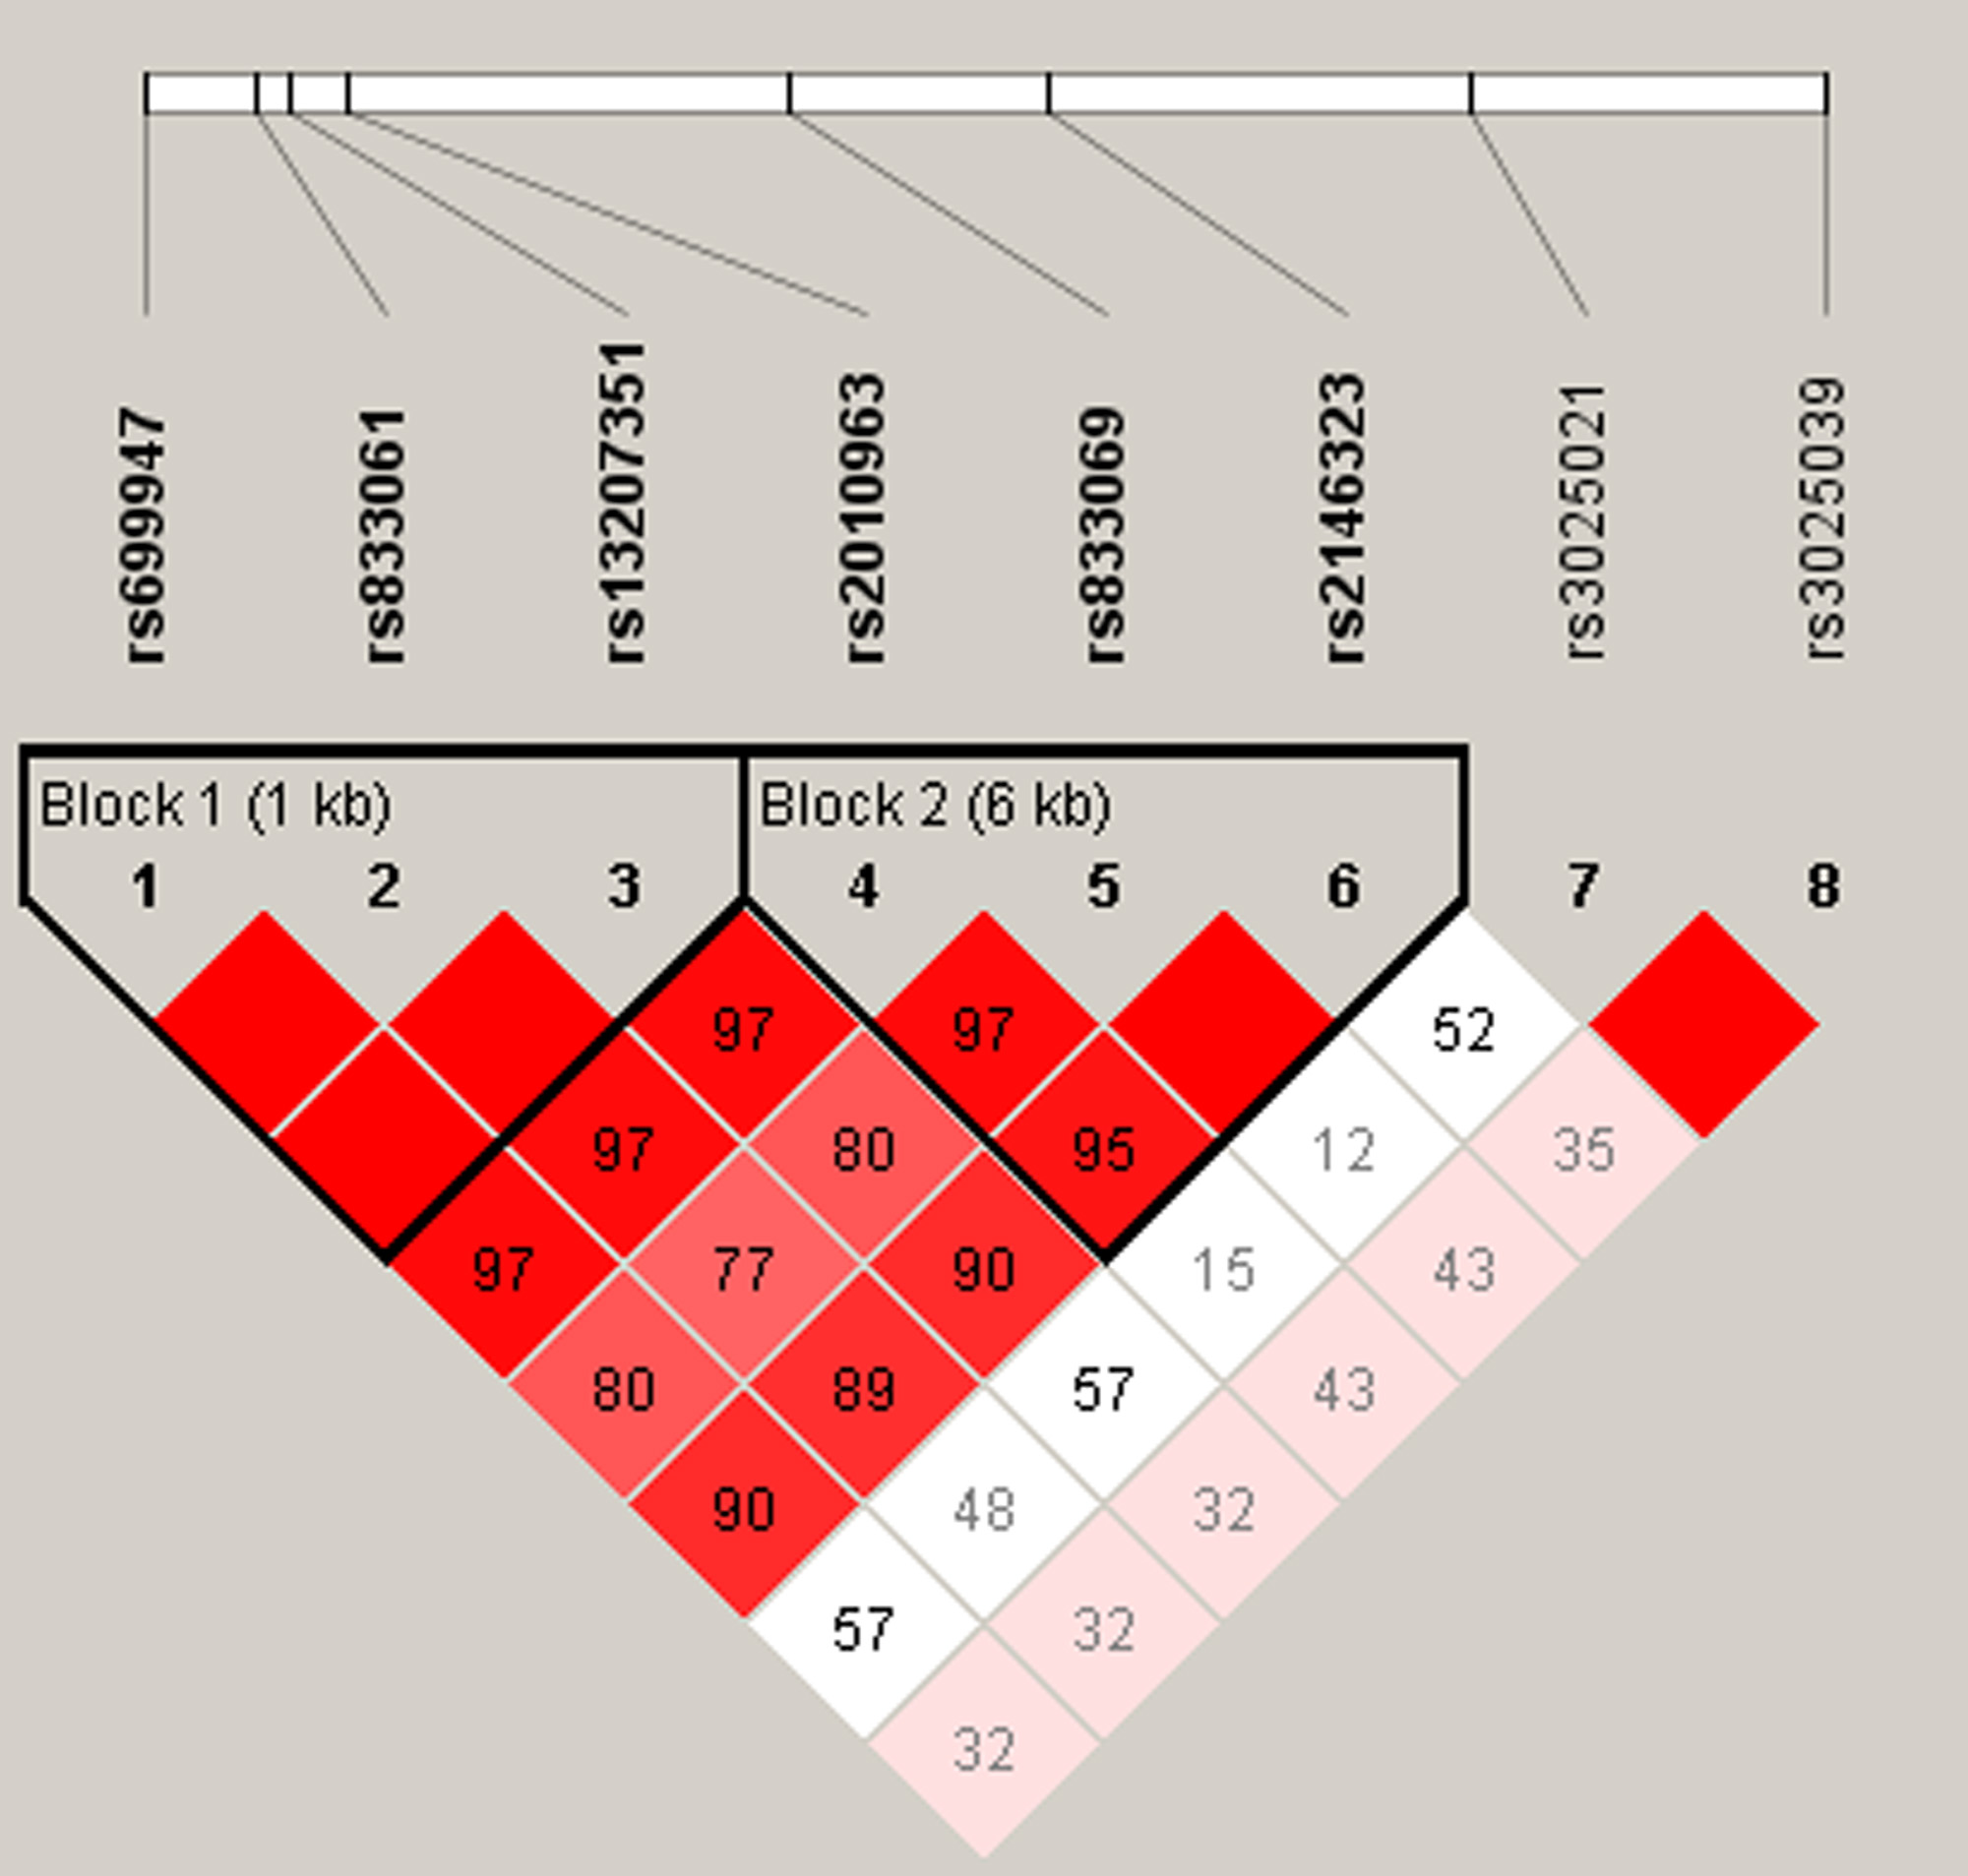
Figure 1. Linkage disequilibrium plot
generated by
Haploview
4.2 software. Two haplotype blocks (bold) were identified
for single nucleotide polymorphisms (SNPs) in the vascular
endothelial growth factor (
VEGF) gene. Linkage
disequilibrium (LD) is displayed as pairwise D’ values
multiplied by 100 and given for each SNP combination [40].
Shading represents the magnitude and significance of pairwise
LD, with a red-to-white gradient reflecting higher-to-lower LD
values. Red diamond without a number corresponds to D’ values of
1.0.
 Figure 1
of Yang, Mol Vis 2011; 17:3088-3096.
Figure 1
of Yang, Mol Vis 2011; 17:3088-3096.