Figure 6. Fundus photographs, fluorescein angiography, and optical coherence tomography (OCT) scans of patient D-3. A, B: Widespread RPE dystrophy and yellowish deposits at the posterior pole with (C, D) bilateral macular hyperfluorescence and small hyperfluorescent spots at the posterior pole and mid-periphery. E, F: Bilateral macular cystoid spaces and two cleavage plans: the outer one between the retinal pigment epithelium (RPE) and
the neuroretina and the inner one below the nerve fibers layer. OD represents the right eye; OS represents the left eye.
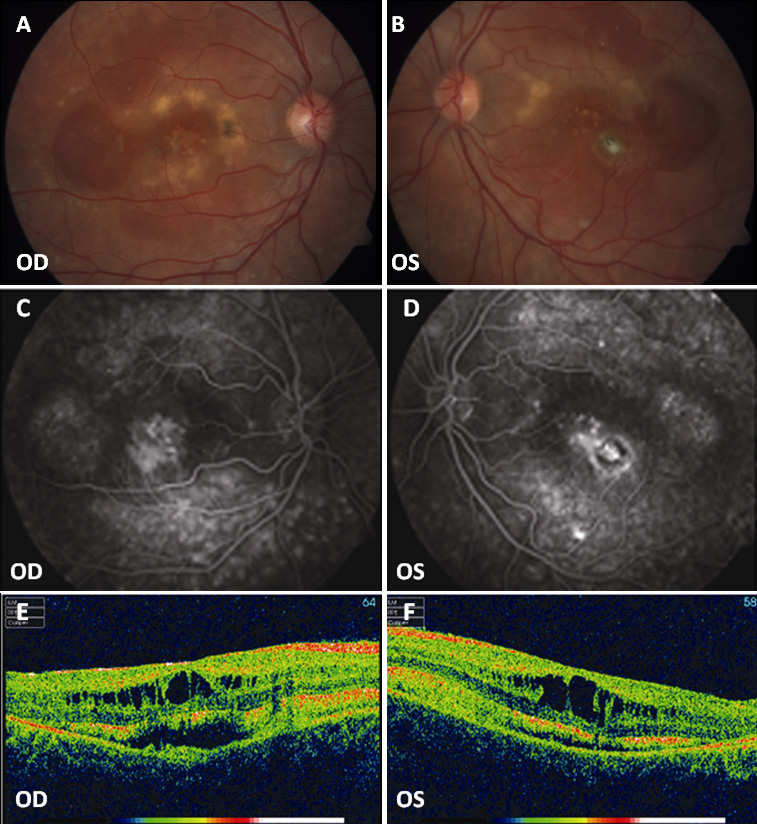
 Figure 6 of
Sodi, Mol Vis 2011; 17:3078-3087.
Figure 6 of
Sodi, Mol Vis 2011; 17:3078-3087.