Figure 3. Relative distributions of
mitochondrial lengths. Histogram plots show the relative distributions
of mitochondrial length for 0 µM (A-C), 50 μM (D-F),
200
µM (G-I), and 600 µM (J-L)
menadione-treated lenses at 4 h, 24 h, and 48 h. Only mitochondria less
than 26 µm in length, comprising a minimum of 95% of the total number
of mitochondria, are shown. Percentages indicating the cumulative
relative frequency of mitochondria ≤8 µm in length are also shown on
each graph. Asterisks (*) denote significant change over time within a
given concentration treatment group with respect to the 4 h time point.
Daggers (†) denote a significant change in relative distribution for a
given mitochondrial size with respect to 0 µM-treated lenses. A general
shift toward a greater relative frequency of smaller mitochondria as a
function of both time and concentration is observed.
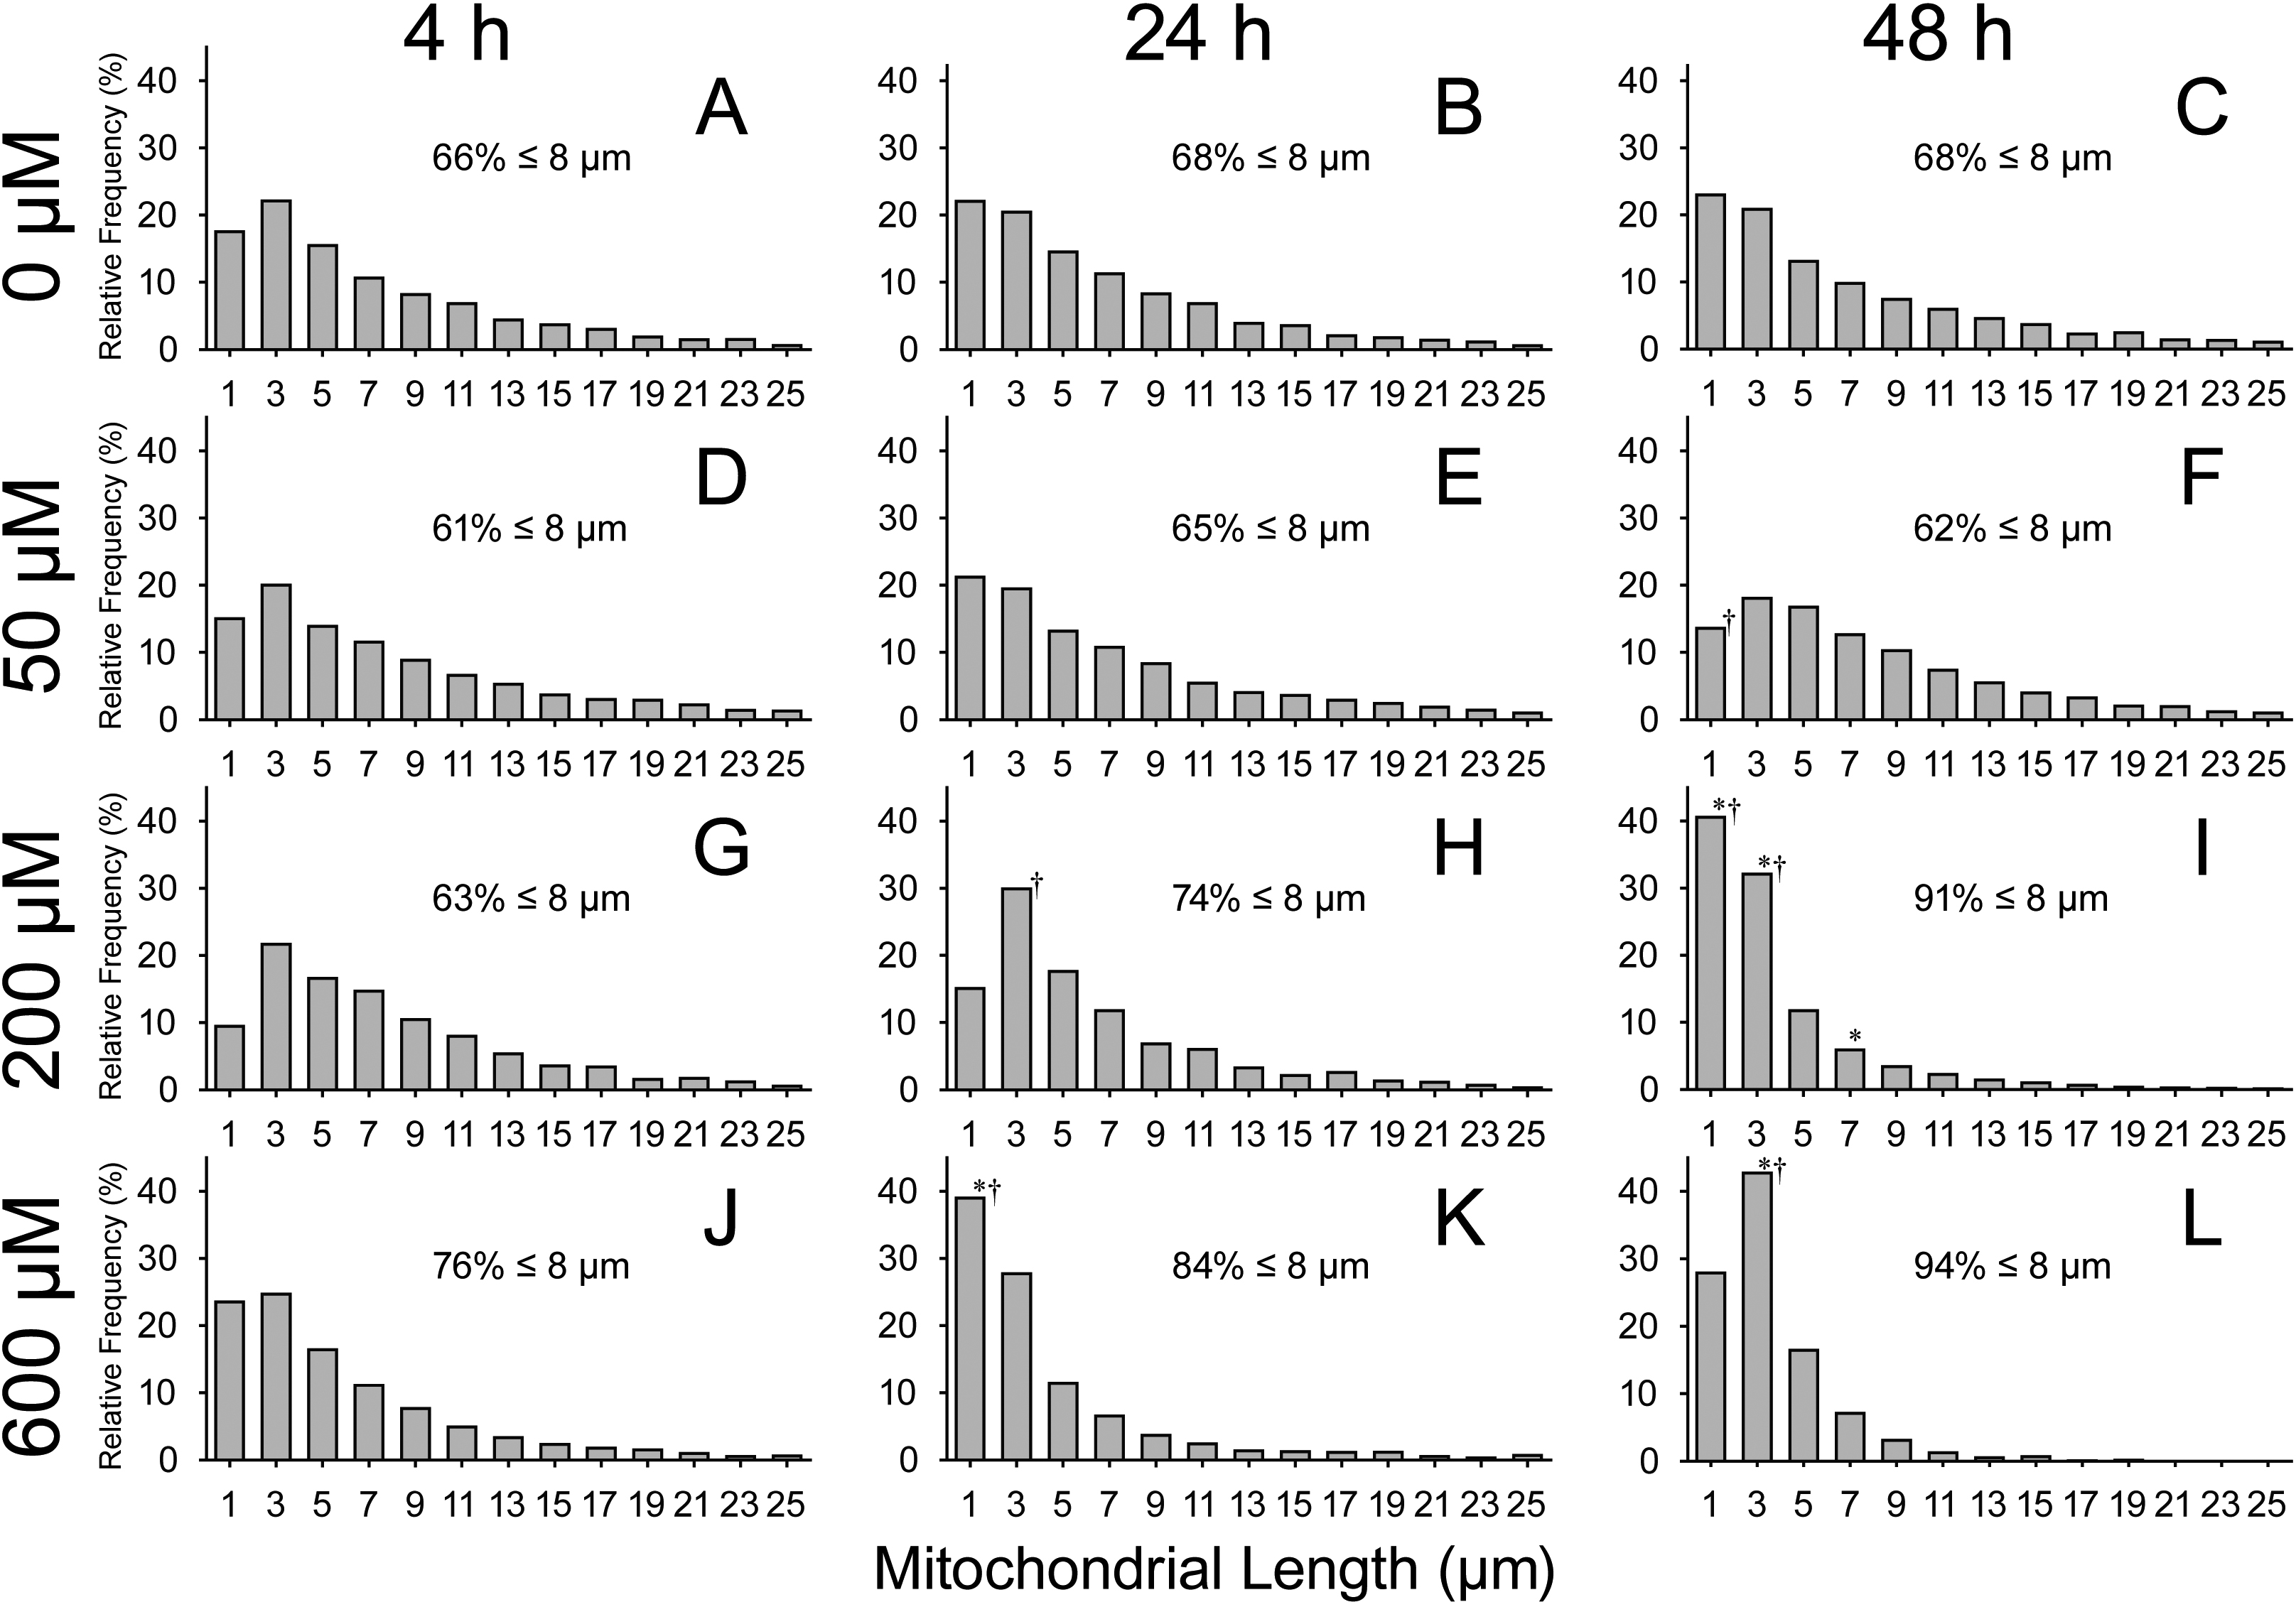
 Figure 3 of Olsen, Mol Vis 2011; 17:270-278.