Figure 2. Effects of menadione on
mitochondrial integrity. Representative confocal micrographs of
mitochondria in secondary fiber cells for 0 µM (A-C), 50
µM (D-F), 200 µM (G-I) and 600 µM (J-L)
menadione-treated
lenses at 4 h, 24 h, and 48 h. Scale bar represents
20 µm. Note the increase in the number of smaller mitochondria as
menadione concentration and time increase.
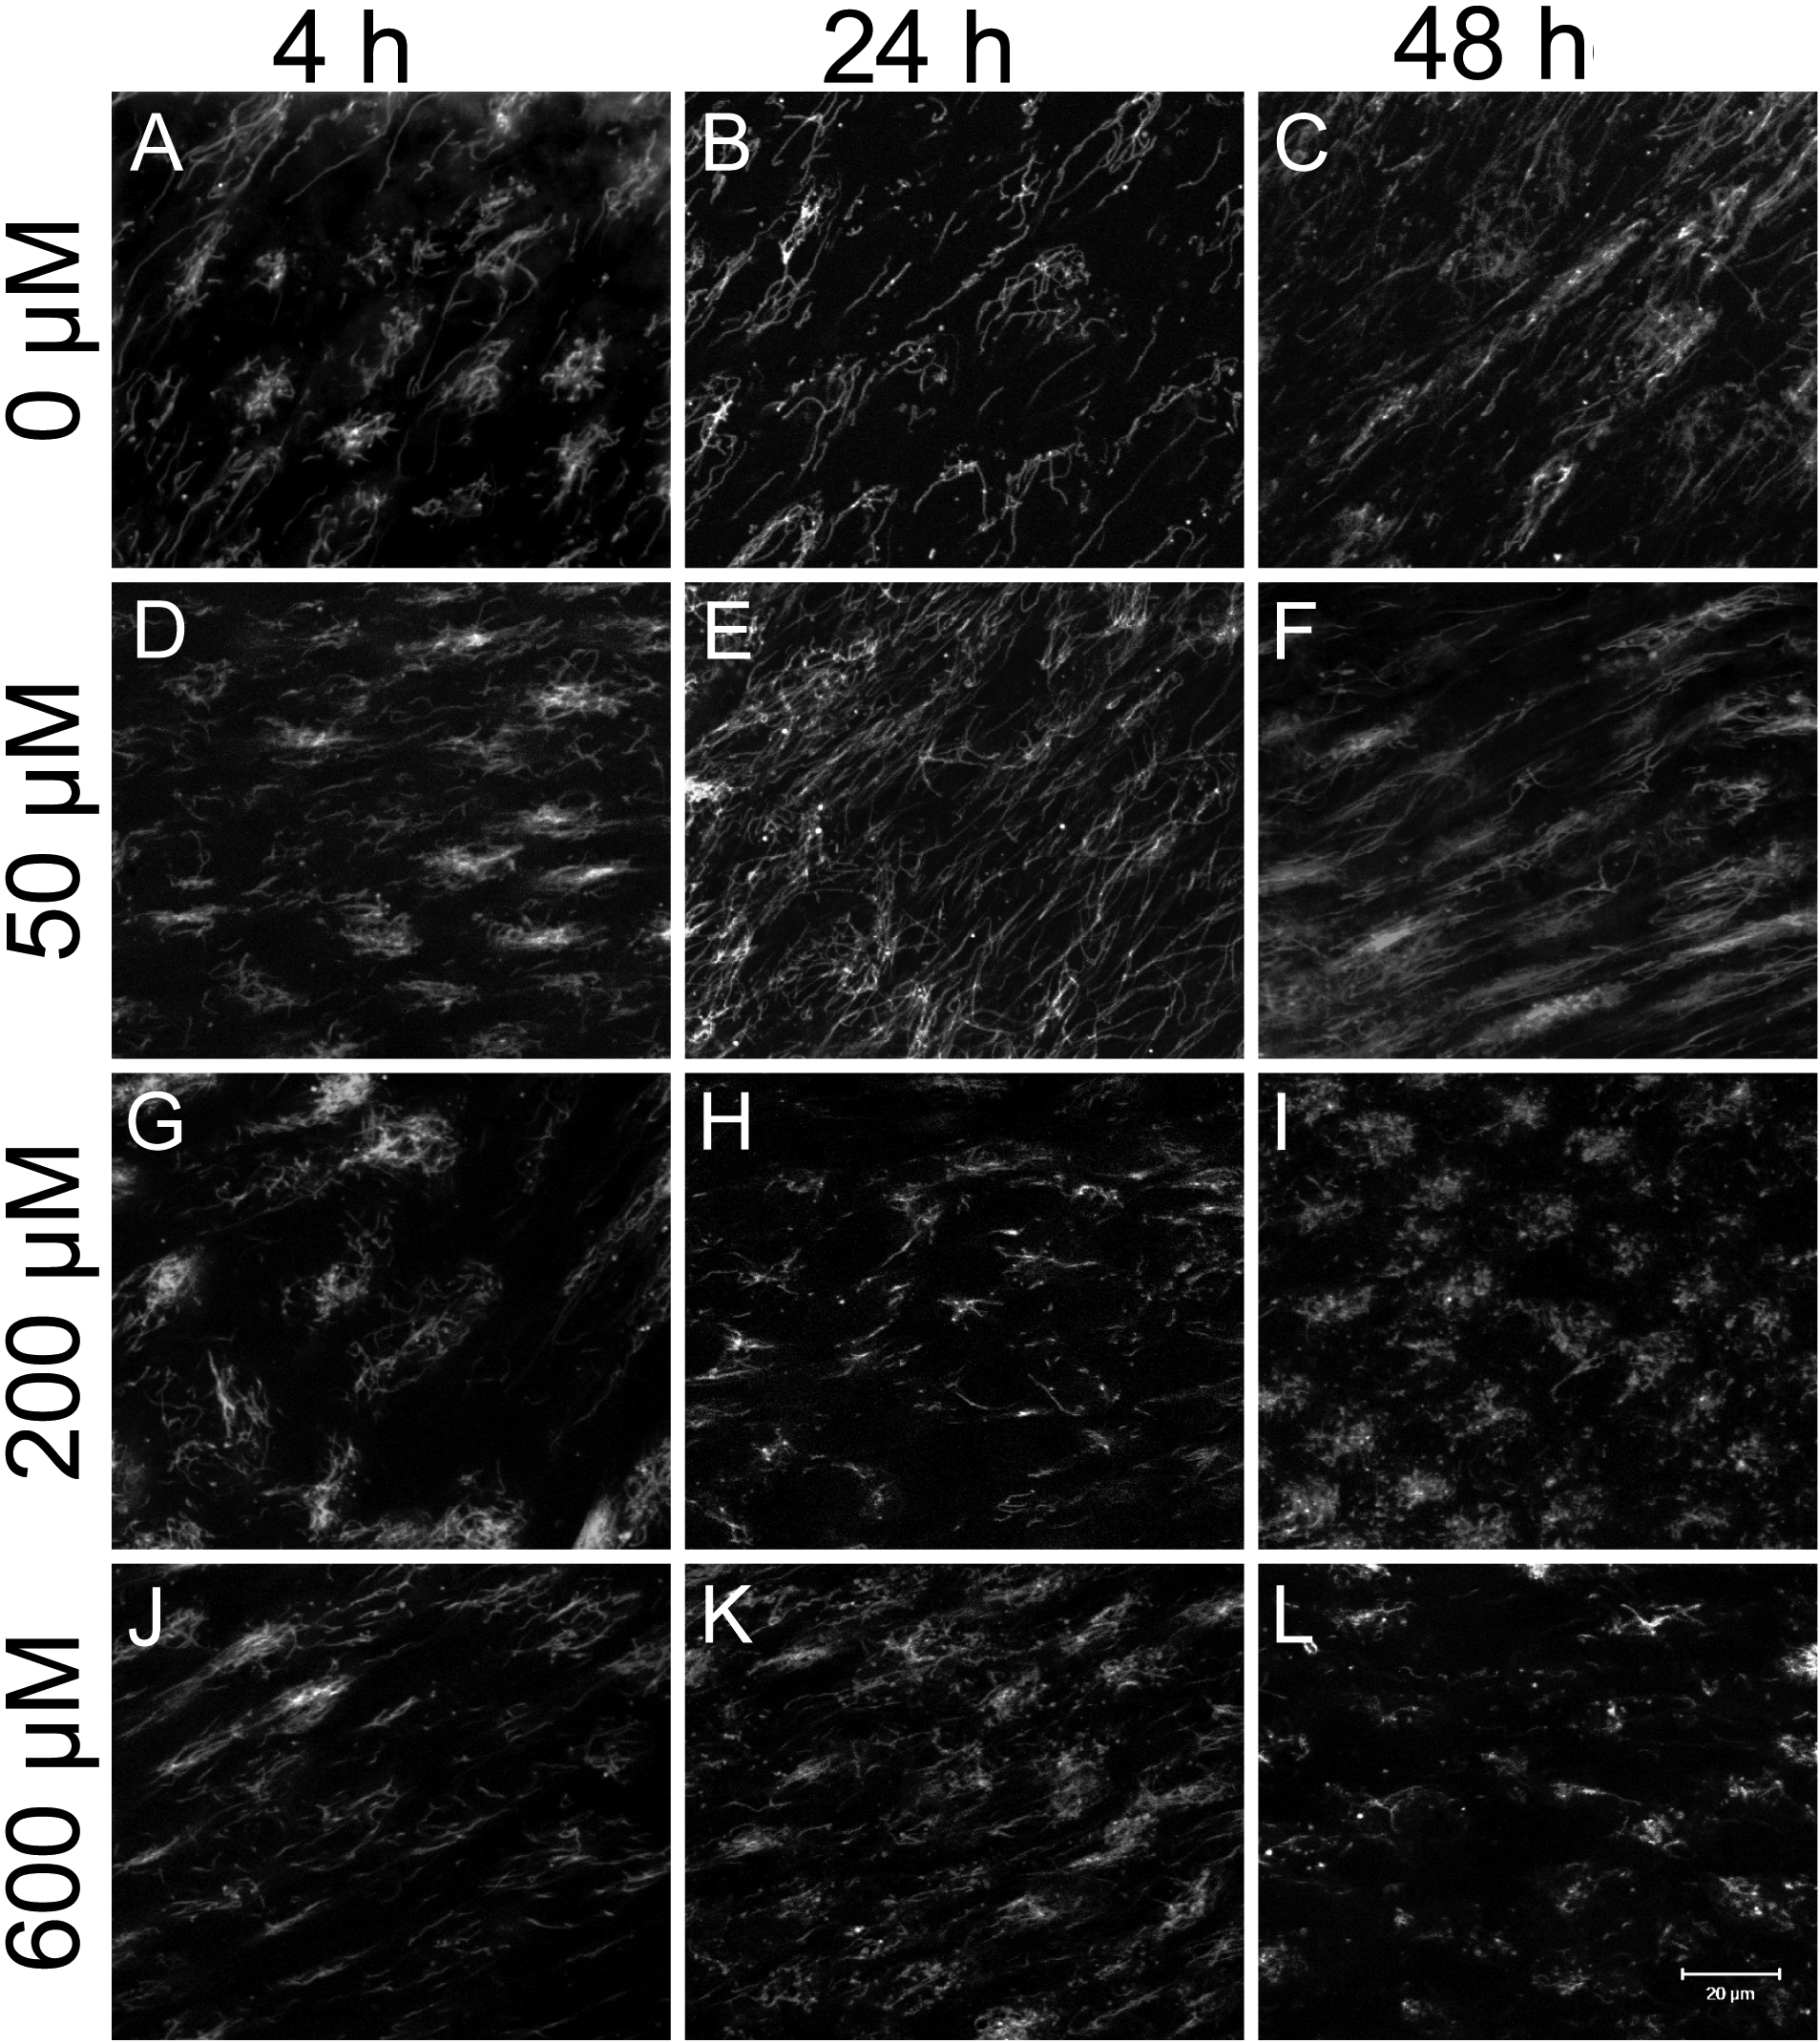
 Figure 2 of Olsen, Mol Vis 2011; 17:270-278.