Figure 1. Effects of menadione on back vertex distance variability. Line graphs show the effects of 0 µM (control; black circles), 50
μM (blue diamonds), 200 μM (red triangles), 600 µM (orange squares) and 1,000 µM (green hexagons) menadione treatment on BVD
variability (±standard error). Asterisks (*) denote significant changes (p≤0.05) in BVD variability with respect to its pre-treated
scan (time 0). Daggers (†) denote significant changes in BVD variability with respect to the control group (0 µM) at the given
time point. Results show an increase in BVD variability as a function of menadione concentration and time.
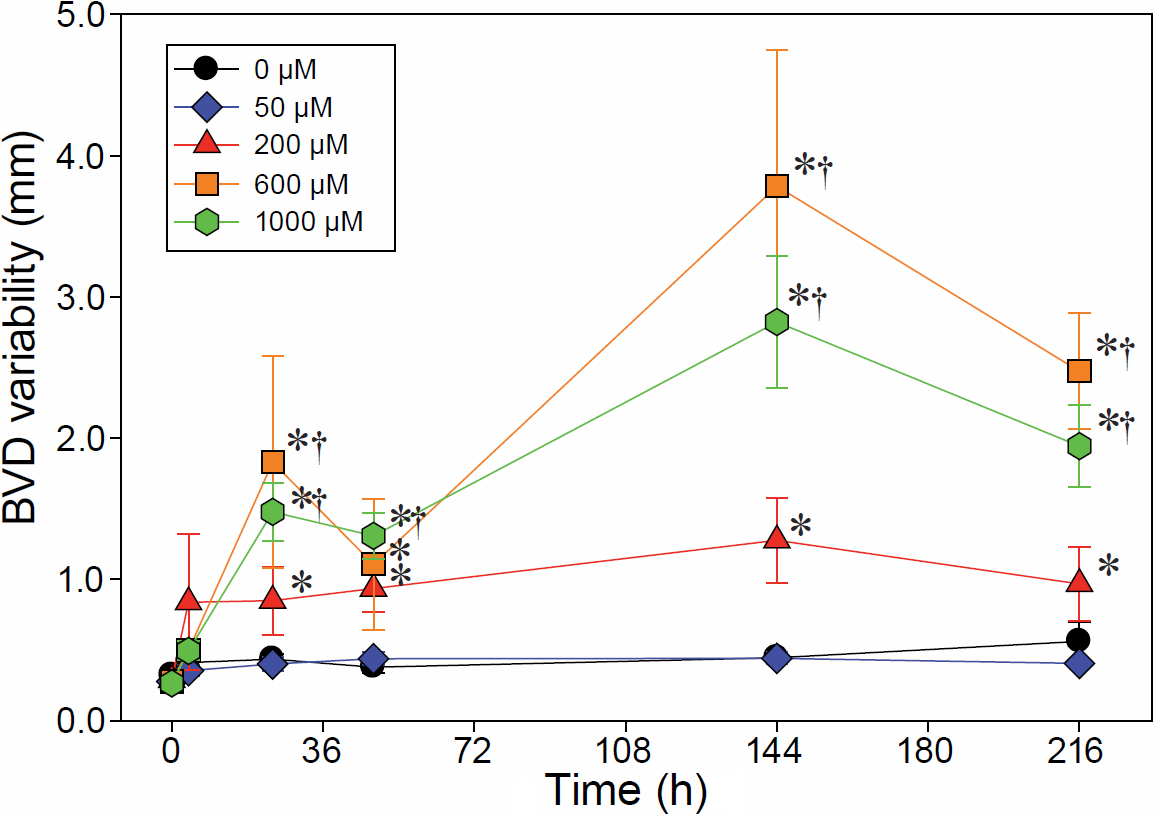
 Figure 1 of
Olsen, Mol Vis 2011; 17:270-278.
Figure 1 of
Olsen, Mol Vis 2011; 17:270-278.