Figure 2 of
Cheriyan, Mol Vis 2011; 17:3055-3061.
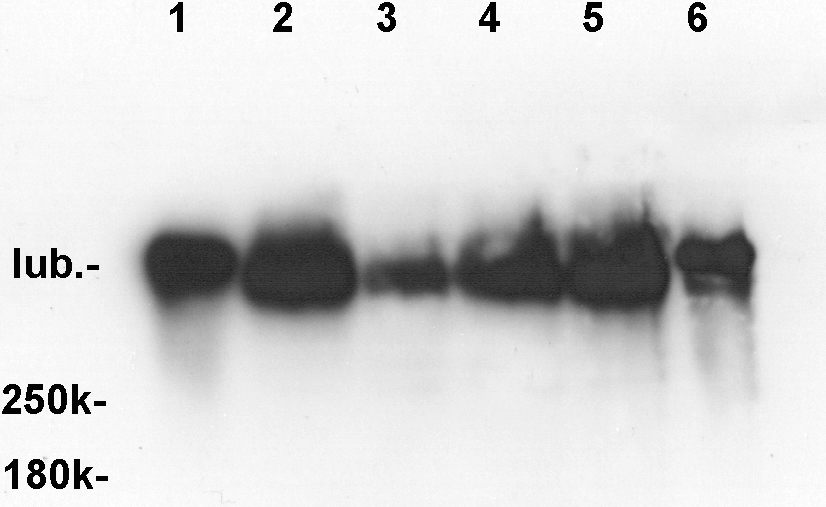
Figure 2.
Western blot analysis showing the position of the lubricin bands on the gel relative to the 250K and 180K ProSieve QuadColor protein markers (#00193838; Lonza, Rockland, ME).
 Figure 2 of
Cheriyan, Mol Vis 2011; 17:3055-3061.
Figure 2 of
Cheriyan, Mol Vis 2011; 17:3055-3061.