Figure 5. Heatmaps and hierarchical
clusters of differentially expressed rod-specific genes and
cone-specific genes or those involved in retinal remodeling.
Heatmaps with dendrograms of clusters of differentially
expressed rod genes (A) and cone / retinal remodeling
genes (B) by applying hierarchical clustering. A filtered
list of mRNA transcript isoforms was further revised for fold
change ≥1.5 and p-value <0.05, and duplicate gene symbol rows
were deleted to retain the most expressed isoform as reflective
of the gene. This list was used to generate the heatmap and the
master cluster. Specific clusters of rod specific genes and
cone-specific or retinal remodeling genes were identified as
clusters containing known rod genes (e.g., Rhodopsin [Rho],
guanine nucleotide binding protein, alpha transducing 1 [Gnat1],
cyclic nucleotide gated channel alpha 1 [Cnga1], and
nuclear receptor subfamily 2, group E, member 3 [Nr2e3])
and cone genes (e.g., fatty acid binding protein 7, brain [Fabp7],
cyclic nucleotide gated channel alpha 3 [Cnga3], cyclic
nucleotide gated channel beta 3 [Cngb3]). Columns 1, 2,
and 3 are wild-type samples, and columns 4, 5, and 6 are Nrl−/−
samples.
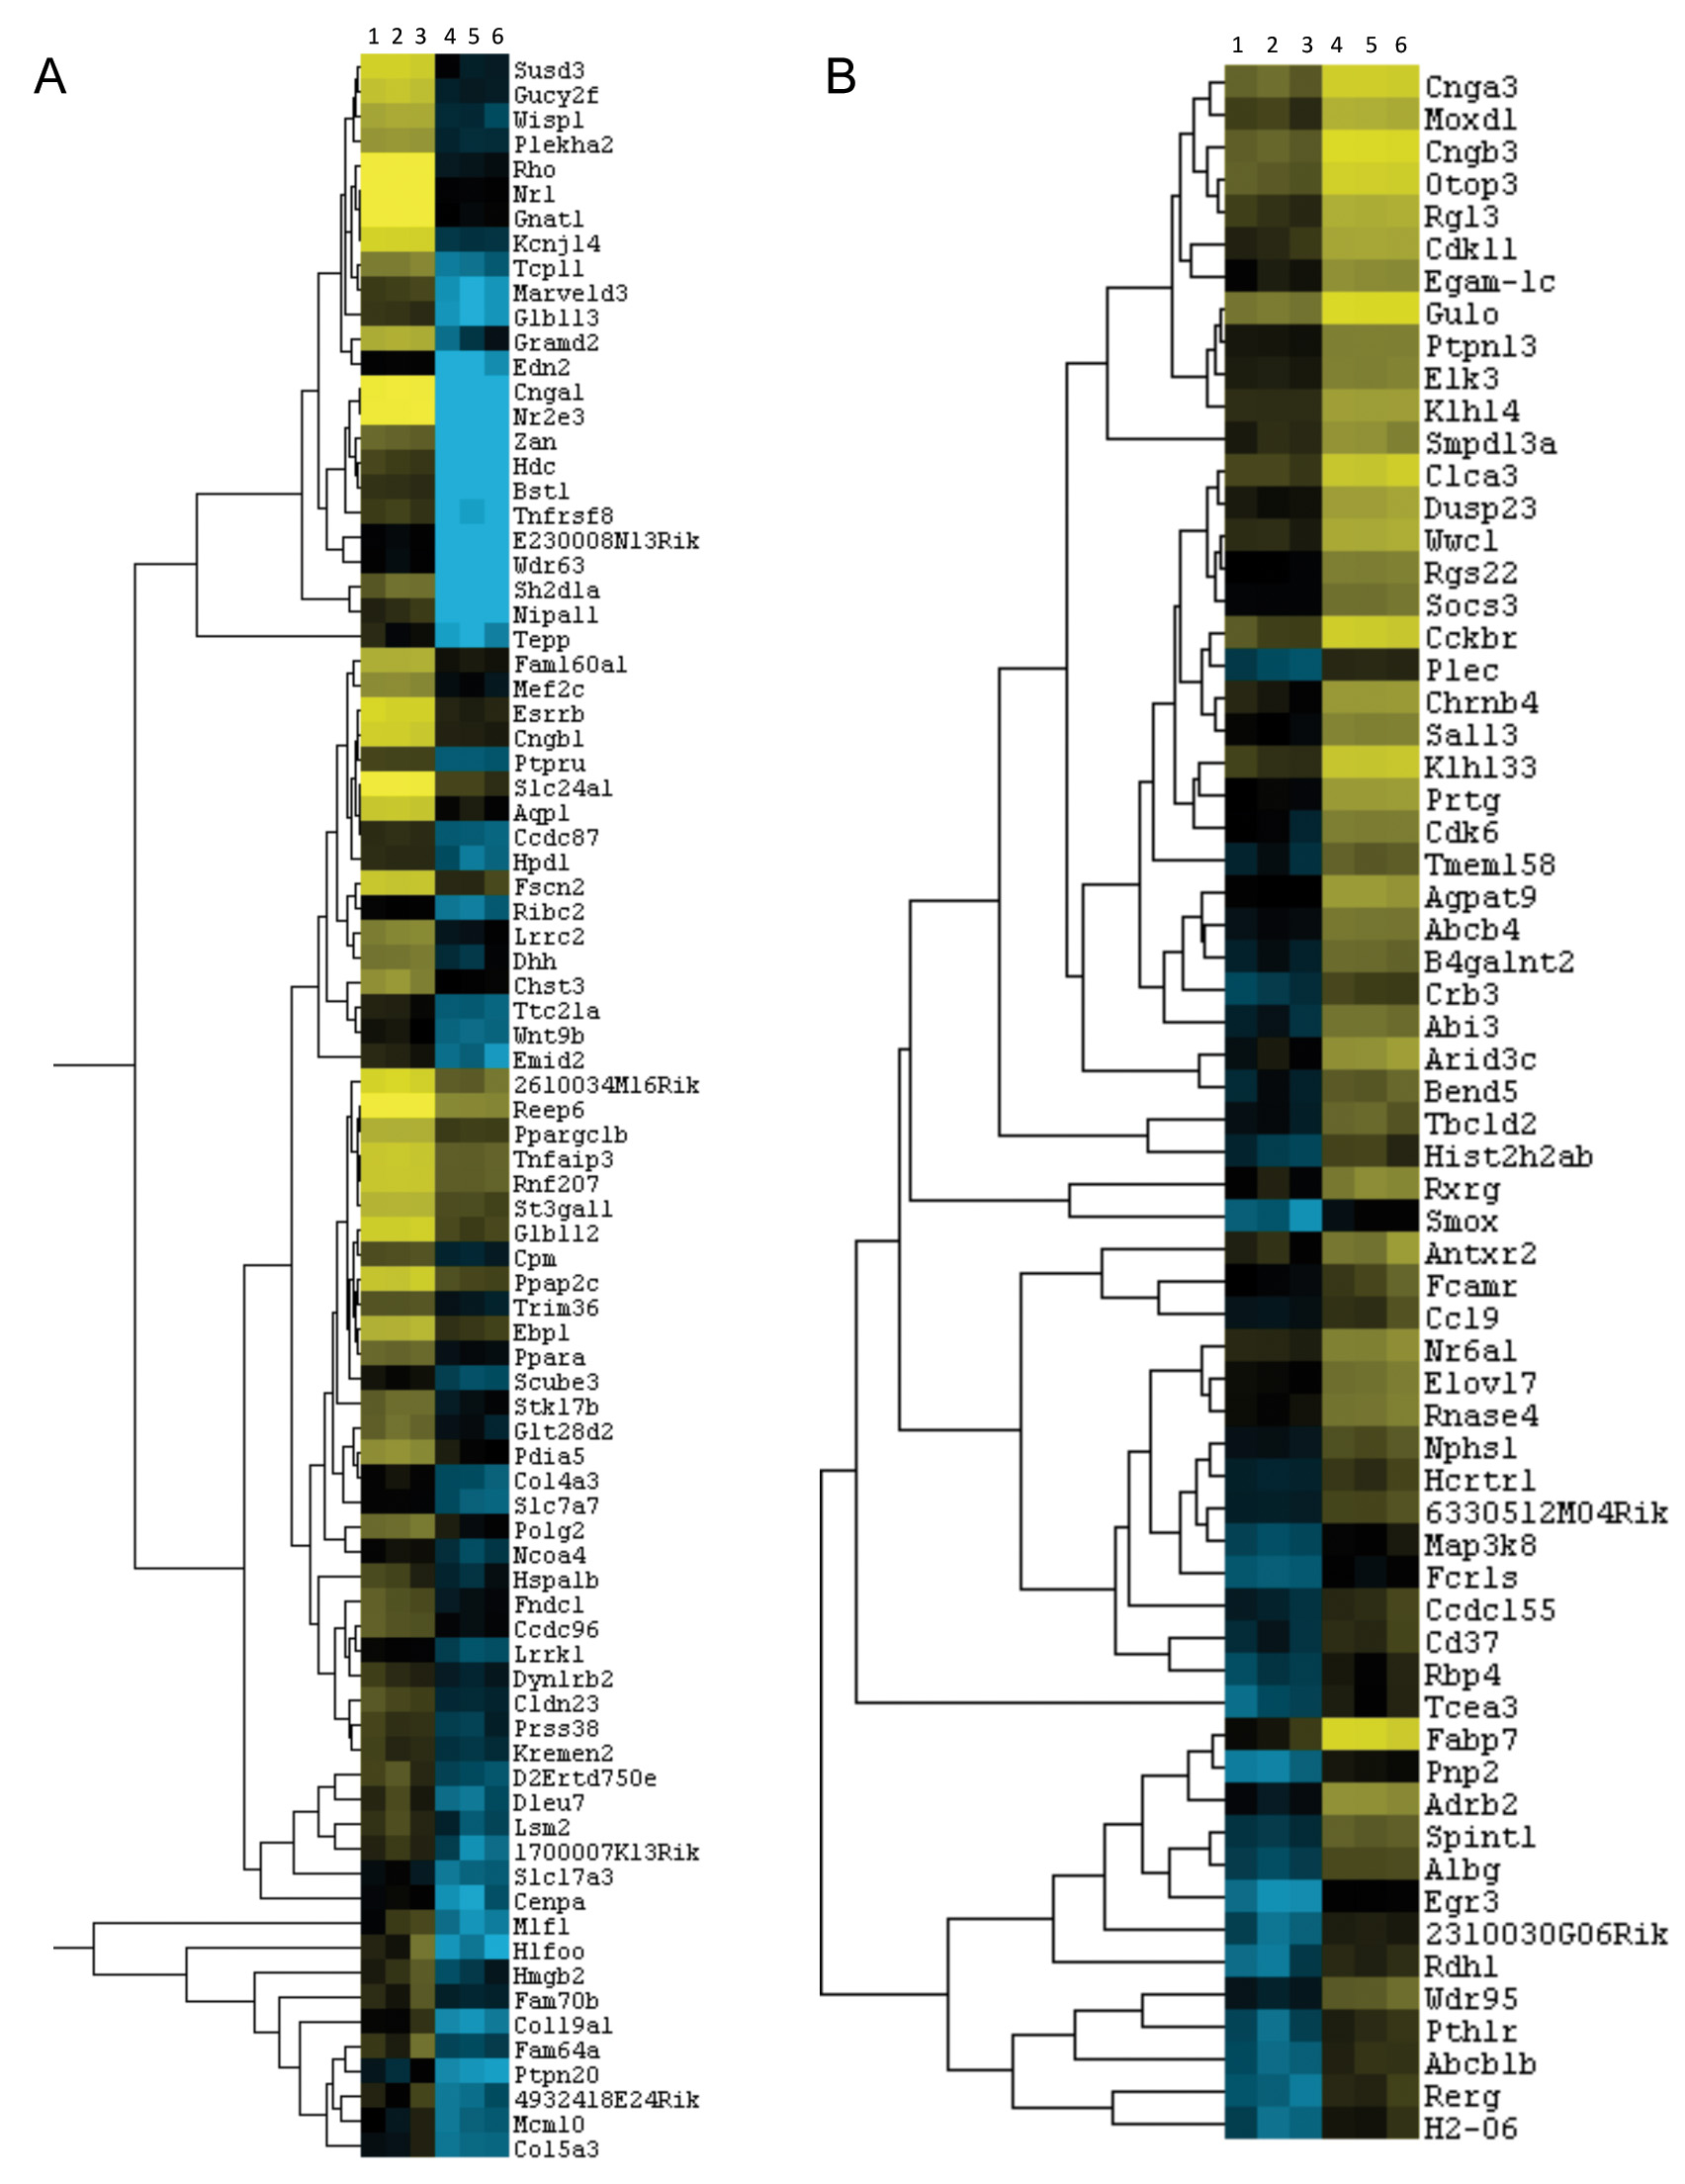
 Figure 5
of Brooks, Mol Vis 2011; 17:3034-3054.
Figure 5
of Brooks, Mol Vis 2011; 17:3034-3054.