Figure 3. Correlation of RNA-seq and
qRT–PCR. The correlations between the RNA-seq fragments per
kilobase of exon model per million mapped reads (FPKM) values
and the corresponding qRT–PCR crossing threshold (Ct) values are
shown. FPKM values represented in log2 scale, and
non-normalized Ct values are an average of three biologic
replicates. Data generated from differentially expressed genes
(black) is contrasted with data generated from the housekeeping
genes (red). The dashed line, associated equation, and goodness
of fit value were generated by least-squares regression analysis
of the differentially expressed data set. Since a lower Ct value
indicates an increased initial amount of target mRNA, an inverse
relationship between FPKM and Ct values is expected if a
correlation exists.
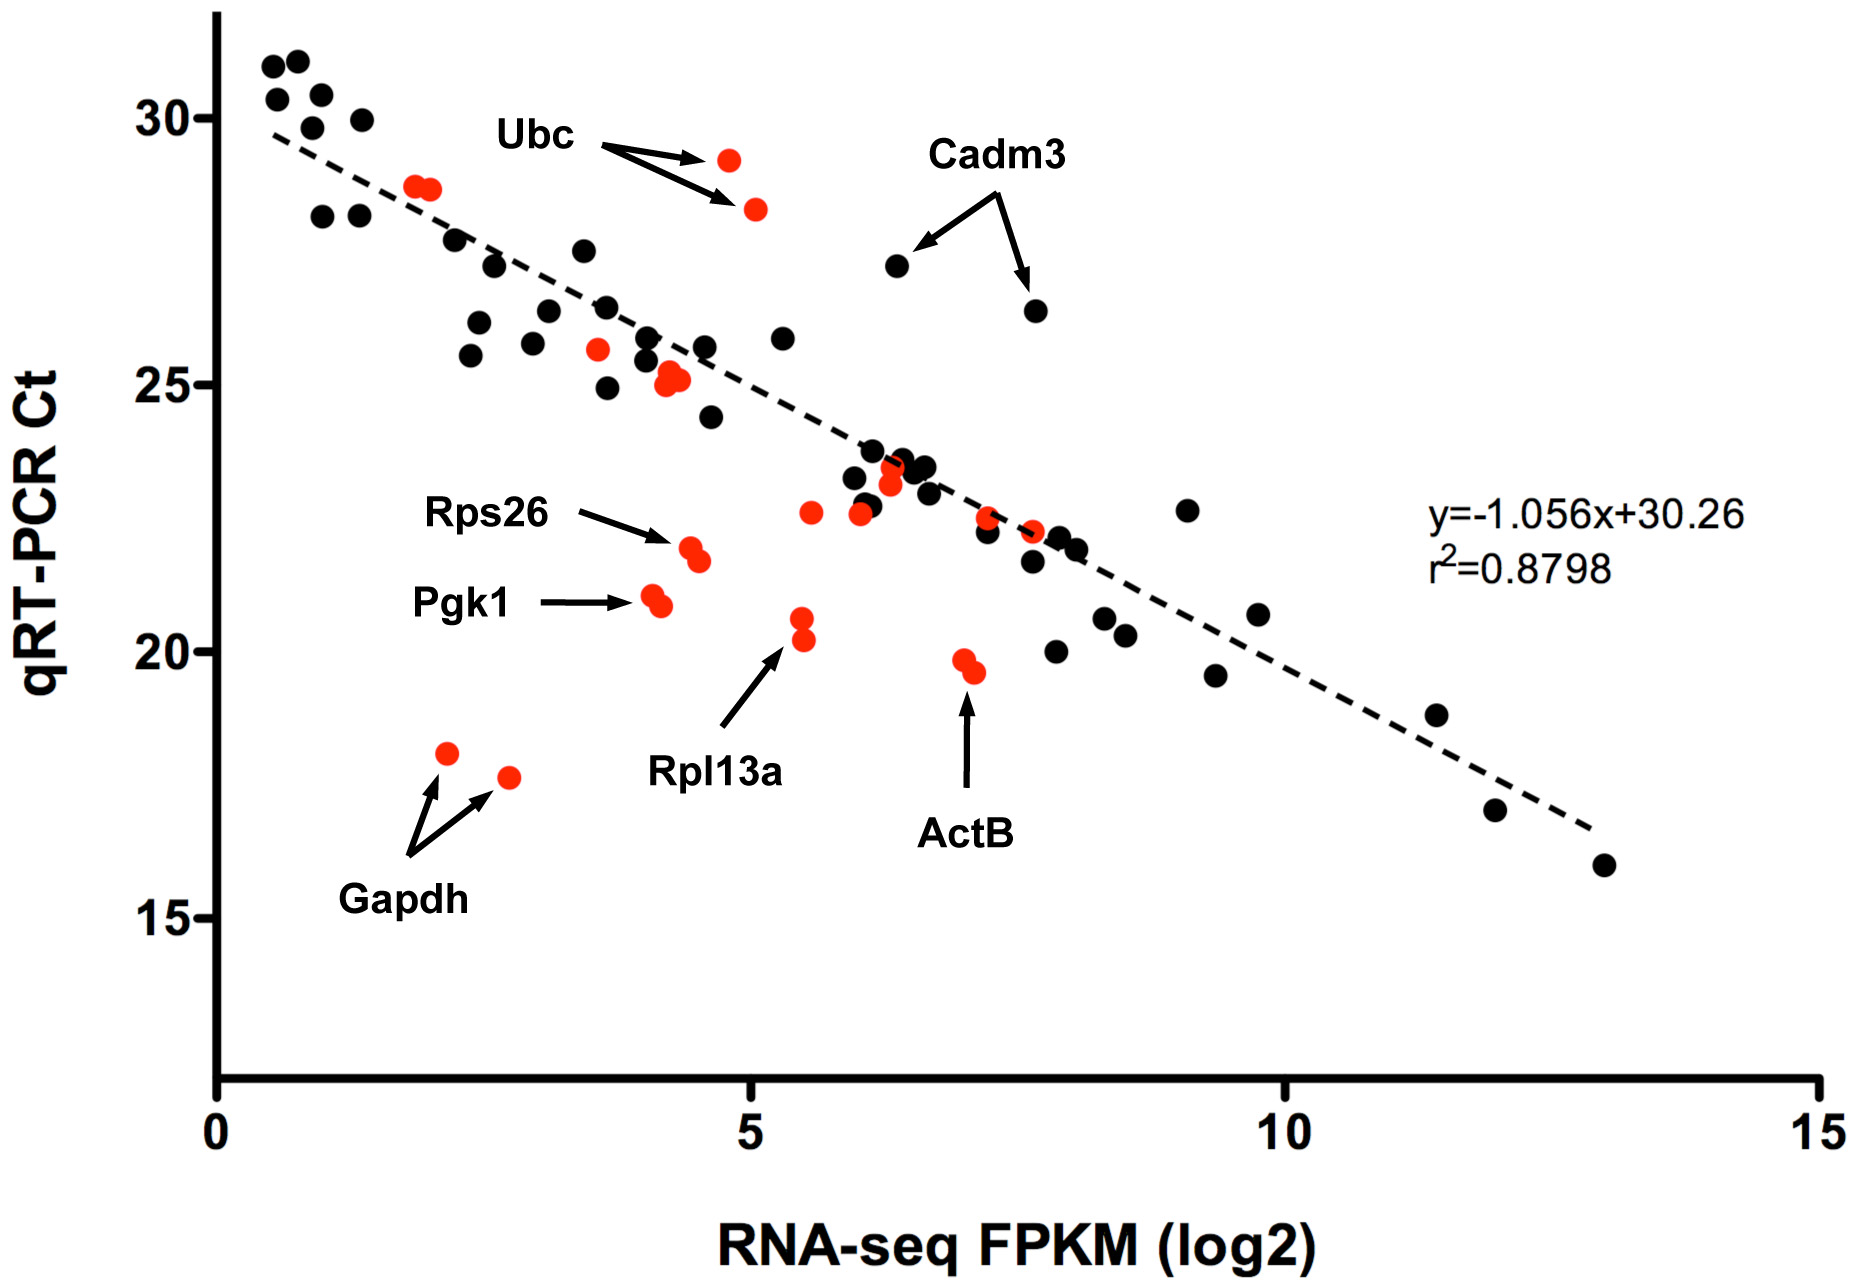
 Figure 3
of Brooks, Mol Vis 2011; 17:3034-3054.
Figure 3
of Brooks, Mol Vis 2011; 17:3034-3054.