Figure 2. Venn diagrams comparing
differentially expressed transcripts (DETs) between the Nrl−/−
and WT groups from BWA and TopHat analyses. Despite major
differences in the UCSC refFlat annotations used by
Burrows-Wheeler Aligner (BWA) and Ensembl annotations used by
TopHat, most of the genes identified by BWA were also identified
as significant by TopHat. A: Comparison of the total
number of DETs identified as significant (fold change ≥1.5 and
p-value <0.05) by the two methods. B: Inclusion of
the top 500 DETs (424 unique genes) identified as significant by
BWA and in the full TopHat DET list. C: Inclusion of the
top 200 DETs (179 unique genes) identified as significant by BWA
and in the full TopHat DET list. We assess the two methods based
on a comparison of qRT–PCR data for the genes detected by either
or both methods. The discrepancy between the results can be
attributed to differences in the input annotation files used
(UCSC refFlat versus Ensembl GTF) by the two methods and their
alignment algorithms.
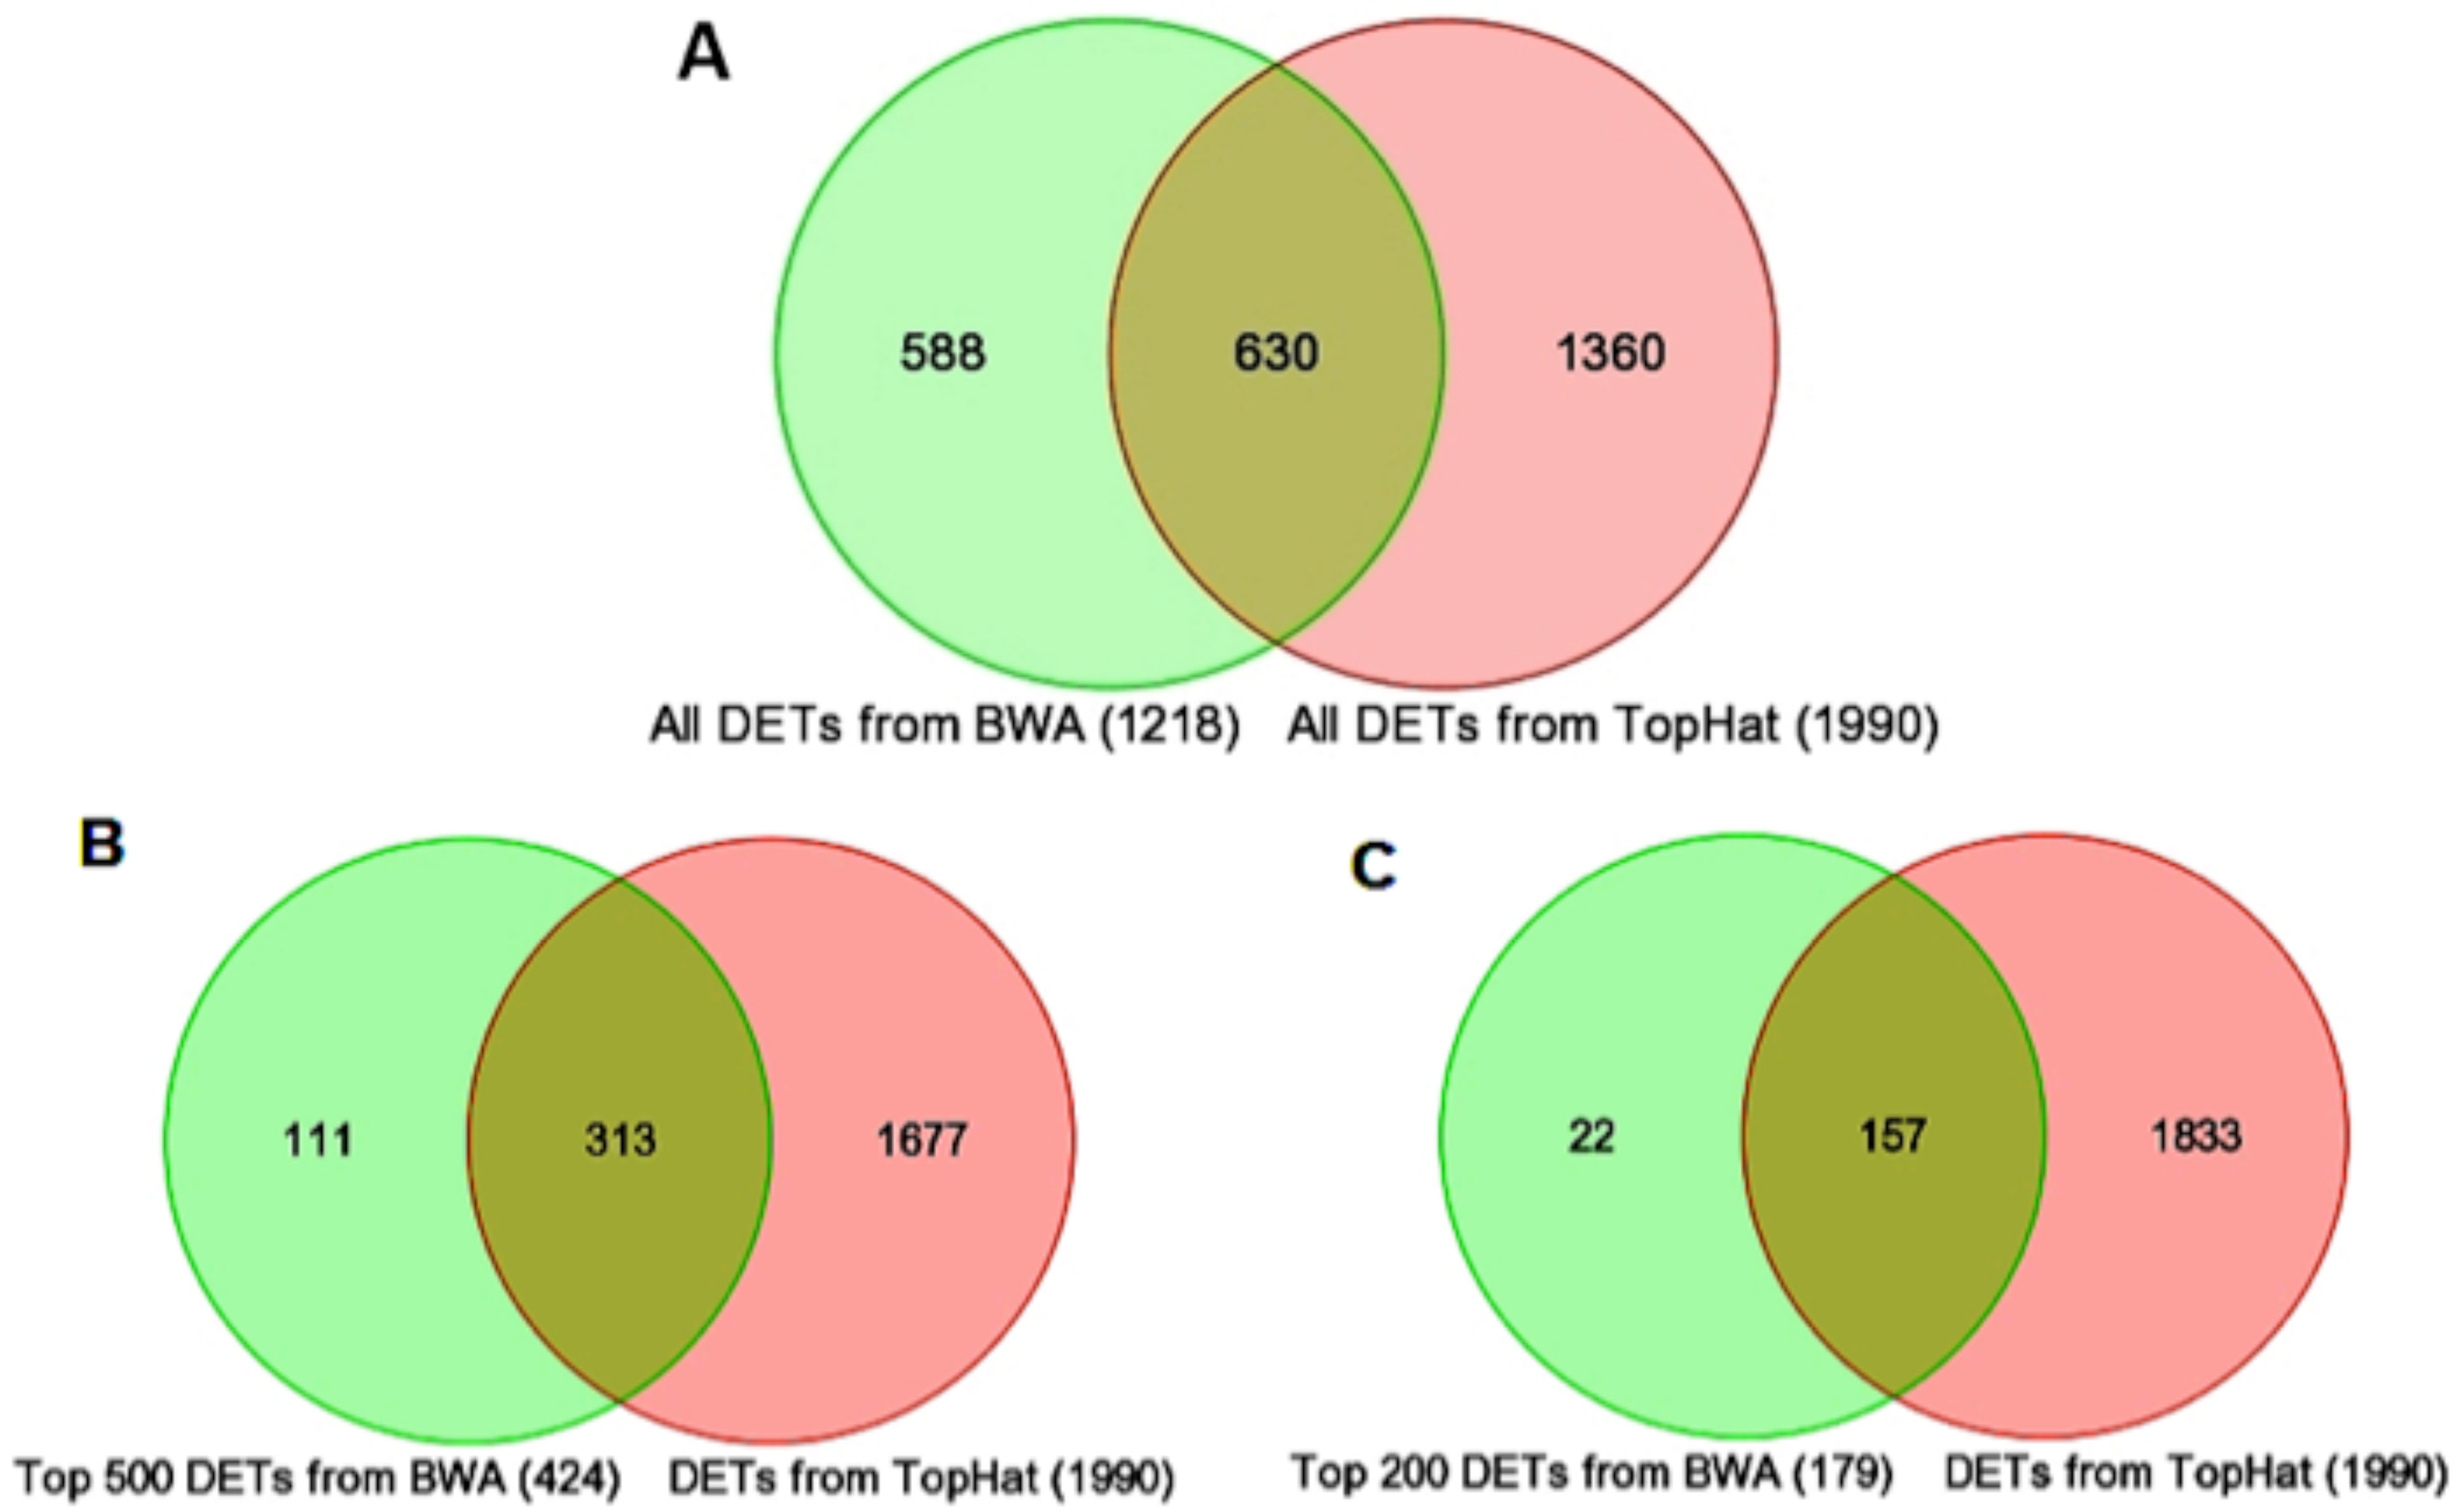
 Figure 2
of Brooks, Mol Vis 2011; 17:3034-3054.
Figure 2
of Brooks, Mol Vis 2011; 17:3034-3054.